


On the heels of consecutive months of decreasing demand for design services, the Architecture Billings Index (ABI) has returned to positive territory.
The American Institute of Architects (AIA) reported that the May ABI score was 52.6, up sharply from a mark of 49.6 in April. This score reflects an increase in design activity (any score above 50 indicates an increase in billings). The new projects inquiry index was 63.2, up from the reading of 59.1 the previous month.
The AIA has added a new indicator measuring the trends in new design contracts at architecture firms that can provide a strong signal of the direction of future architecture billings. The score for design contracts in May was 52.5.
“Volatility continues to be the watchword in the design and construction markets, with firms in some regions of the country, and serving some sectors of the industry, reporting strong growth, while others are indicating continued weakness,” said AIA Chief Economist Kermit Baker, Hon. AIA, PhD. “However, overall, it appears that activity has recovered from the winter slump, and design professions should see more positive than negative numbers in the coming months.”
Key May ABI highlights:
- Regional averages: South (58.1), Midwest (51.3), Northeast (47.6) , West (46.9)
- Sector index breakdown: multi-family residential (58.2), commercial / industrial (53.6), mixed practice (50.4), institutional (47.3)
- Project inquiries index: 63.2
- Design contracts index: 52.5
The regional and sector categories are calculated as a 3-month moving average, whereas the national index, design contracts and inquiries are monthly numbers.
Related Stories

Digital Twin | Aug 27, 2020
The Weekly show: Digital twin technology and social equity in the AEC market
The August 27 episode of BD+C's "The Weekly" is available for viewing on demand.

Architects | Aug 26, 2020
We the People: Four steps for the architecture profession to build unity through design
Architect offers a 4-point manifesto to the design community to work for racial and social justice in the U.S. following the death of George Floyd.

Coronavirus | Aug 25, 2020
Video: 5 building sectors to watch amid COVID-19
RCLCO's Brad Hunter reveals the winners and non-winners of the U.S. real estate market during the coronavirus pandemic.
Architects | Aug 19, 2020
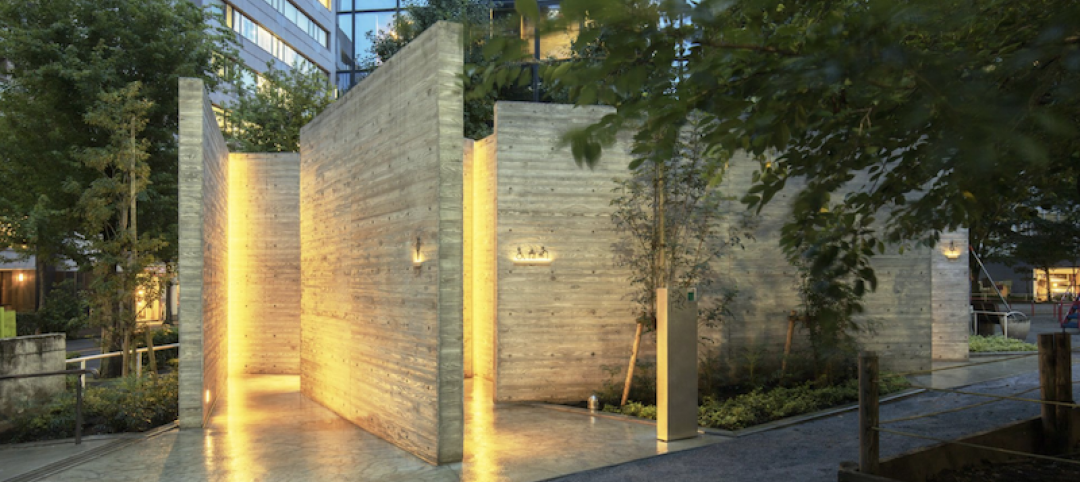
Japan’s Tokyo Toilet project looks to improve the perception of public restrooms
17 toilets throughout Shibuya will be redesigned as part of the project.
Architects | Aug 5, 2020
Final report: BD+C's 2020 Color Trends Report
This special research report from the editors of BD+C explores the leading trends and drivers related to the use of color on commercial, institutional, and multifamily building projects.

University Buildings | Aug 2, 2020
R&D hubs, modular-built hotels, and an award-winning student center on the August 6 “The Weekly”
R&D hubs, modular-built hotels, and an award-winning student center on the August 6 “The Weekly”

University Buildings | Jul 24, 2020
A hybrid learning approach could redefine higher education
Universities reassess current assets to determine growth strategies.

Coronavirus | Jun 19, 2020
Experts address COVID-19's impact on nursing homes and schools on The Weekly
The June 18 episode of BD+C's "The Weekly" is available for viewing on demand.

Coronavirus | Jun 12, 2020
BD+C launches 'The Weekly,' a streaming program for the design and construction industry
The first episode, now available on demand, features experts from Robins & Morton, Gensler, and FMI on the current state of the AEC market.

Architects | Jun 8, 2020
Two Frank Lloyd Wright sites set to reopen for tours with enhanced health and safety protocols
The sites will reopen on Thursday, June 11.


