


As the prognosis for the design and construction industry continues to improve, the Architecture Billings Index (ABI) is reflecting its strongest growth since November 2007. As a leading economic indicator of construction activity, the ABI reflects the approximate nine to twelve month lag time between architecture billings and construction spending.
The American Institute of Architects (AIA) reported the January ABI score was 54.2, up sharply from a mark of 51.2* in December. This score reflects a strong increase in demand for design services (any score above 50 indicates an increase in billings). The new projects inquiry index was 63.2, much higher than the reading of 57.9 the previous month.
“We have been pointing in this direction for the last several months, but this is the strongest indication that there will be an upturn in construction activity in the coming months,” said AIA Chief Economist, Kermit Baker, PhD, Hon. AIA. “But as we continue to hear about overall improving economic conditions and that there are more inquiries for new design projects in the marketplace, a continued reservation by lending institutions to supply financing for construction projects is preventing a more widespread recovery in the industry.”
Key January ABI highlights:
- Regional averages: Midwest (54.4), West (53.4), South (51.7), Northeast (50.3)
- Sector index breakdown: mixed practice (54.9), multi-family residential (54.5), commercial / industrial (52.0), institutional (50.2)
- Project inquiries index: 63.2
The regional and sector categories are calculated as a 3-month moving average, whereas the index and inquiries are monthly numbers.
About the AIA Architecture Billings Index
The Architecture Billings Index (ABI), produced by the AIA Economics & Market Research Group, is a leading economic indicator that provides an approximately nine to twelve month glimpse into the future of nonresidential construction spending activity. The diffusion indexes contained in the full report are derived from a monthly “Work-on-the-Boards” survey that is sent to a panel of AIA member-owned firms. Participants are asked whether their billings increased, decreased, or stayed the same in the month that just ended as compared to the prior month, and the results are then compiled into the ABI. These monthly results are also seasonally adjusted to allow for comparison to prior months. The monthly ABI index scores are centered around 50, with scores above 50 indicating an aggregate increase in billings, and scores below 50 indicating a decline. The regional and sector data are formulated using a three-month moving average. More information on the ABI and the analysis of its relationship to construction activity can be found in the White Paper Architecture Billings as a Leading Indicator of Construction: Analysis of the Relationship Between a Billings Index and Construction Spending on the AIA web site.
About The American Institute of Architects
Founded in 1857, members of the American Institute of Architects consistently work to create more valuable, healthy, secure, and sustainable buildings, neighborhoods, and communities. Through nearly 300 state and local chapters, the AIA advocates for public policies that promote economic vitality and public well being. Members adhere to a code of ethics and conduct to ensure the highest professional standards. The AIA provides members with tools and resources to assist them in their careers and business as well as engaging civic and government leaders, and the public to find solutions to pressing issues facing our communities, institutions, nation and world. Visit www.aia.org.
* Every January the AIA research department updates the seasonal factors used to calculate the ABI, resulting in a revision of recent ABI values.
Related Stories
Architects | Sep 19, 2016
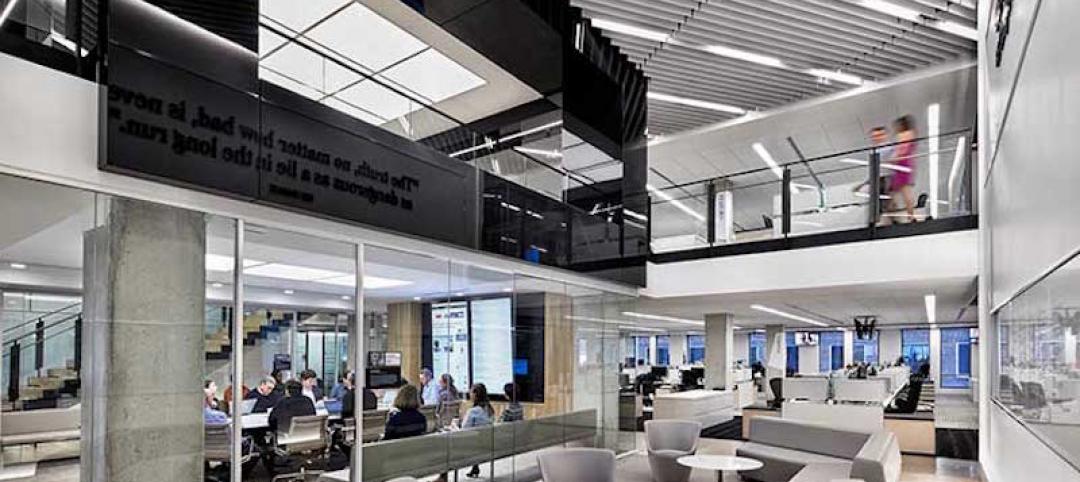
A workplace designed for the innovation economy
Over the past 100 years, how we work has changed dramatically, and these changes have impacted workplace design.

Architects | Sep 16, 2016
Former architect now builds architectural wonders out of LEGO blocks
Adam Reed Tucker’s creations are currently on display at the Museum of Science and Industry.

Architects | Sep 15, 2016
Implicit bias: How the unconscious mind drives business decisions
Companies are tapping into the latest research in psychology and sociology to advance their diversity and inclusion efforts when it comes to hiring, promoting, compensation, and high-performance teaming, writes BD+C's David Barista.

Museums | Sep 14, 2016
Architectural model museum opens in Japan
The museum includes models from Japanese architects including Shingeru Ban, Kengo Kuma, and Riken Yamamoto.
Designers | Sep 13, 2016
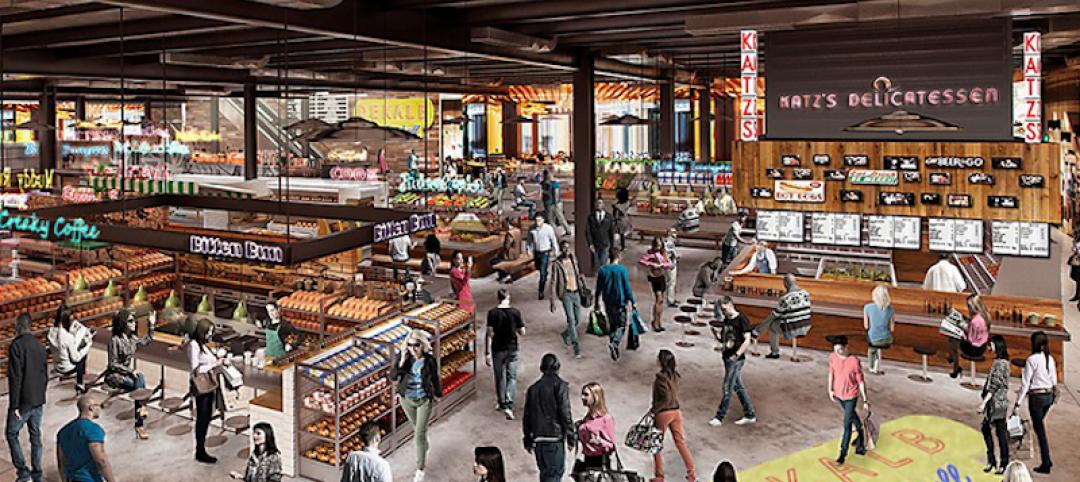
5 trends propelling a new era of food halls
Food halls have not only become an economical solution for restauranteurs and chefs experiencing skyrocketing retail prices and rents in large cities, but they also tap into our increased interest in gourmet locally sourced food, writes Gensler's Toshi Kasai.

AEC Tech | Sep 6, 2016
Innovation intervention: How AEC firms are driving growth through R&D programs
AEC firms are taking a page from the tech industry, by infusing a deep commitment to innovation and disruption into their cultural DNA.

Office Buildings | Sep 2, 2016
Eight-story digital installation added as part of ESI Design’s renovation of Denver’s Wells Fargo Center
The crown jewel of a three-year makeover project, the LED columns bring the building’s lobby to life.
| Sep 1, 2016
TRANSIT GIANTS: A ranking of the nation's top transit sector design and construction firms
Skidmore, Owings & Merrill, Perkins+Will, Skanska USA, Webcor Builders, Jacobs, and STV top Building Design+Construction’s annual ranking of the nation’s largest transit sector AEC firms, as reported in the 2016 Giants 300 Report.

| Sep 1, 2016
INDUSTRIAL GIANTS: A ranking of the nation's top industrial design and construction firms
Stantec, BRPH, Fluor Corp., Walbridge, Jacobs, and AECOM top Building Design+Construction’s annual ranking of the nation’s largest industrial sector AEC firms, as reported in the 2016 Giants 300 Report.

| Sep 1, 2016
HOTEL SECTOR GIANTS: A ranking of the nation's top hotel sector design and construction firms
Gensler, HKS, Turner Construction Co., The Whiting-Turner Contracting Co., Jacobs, and JBA Consulting Engineers top Building Design+Construction’s annual ranking of the nation’s largest hotel sector AEC firms, as reported in the 2016 Giants 300 Report.


