


With all geographic regions and building project sectors showing positive conditions, there continues to be a heightened level of demand for design services signaled in the latest Architecture Billings Index (ABI). As a leading economic indicator of construction activity, the ABI reflects the approximate nine to twelve month lead time between architecture billings and construction spending. The American Institute of Architects (AIA) reported the August ABI score was 53.7, up from a score of 51.9 in the previous month. This score reflects an increase in design services provided by U.S. architecture firms (any score above 50 indicates an increase in billings). The new projects inquiry index was 62.5, up from a reading of 59.5 the previous month, while the new design contracts index eased somewhat from 56.4 to 54.2.
“The August results continue a string of very positive readings from the design professions, pointing to future healthy growth across the major construction sectors, as well as across the major regions of the country,” said AIA Chief Economist, Kermit Baker, Hon. AIA, PhD. “Given the focus and discussions around the infrastructure needs of the nation, we expect strong growth in design activity for the coming months and years.”
View this press release online here: https://www.aia.org/pres
Key August ABI highlights:
• Regional averages: South (55.7), Northeast (54.3), Midwest (52.5), West (51.3)
• Sector index breakdown: commercial / industrial (57.6), multi-family residential (53.8), mixed practice (52.5), institutional (50.1)
• Project inquiries index: 62.5
• Design contracts index: 54.2
The regional and sector categories are calculated as a 3-month moving average, whereas the national index, design contracts and inquiries are monthly numbers.
Related Stories

Market Data | Jul 20, 2020
6 must reads for the AEC industry today: July 20, 2020
Never waste a crisis and robotic parking systems help developers optimize parking amenities.

Market Data | Jul 17, 2020
7 must reads for the AEC industry today: July 17, 2020
Kennedy Middle School's new Administration/Family Center and Tips to make optimal use of salvaged materials.

Market Data | Jul 16, 2020
Final NEPA rule will make it easier to rebuild infrastructure, reinvigorate the economy, and continue protecting the environment
Administration’s final reforms to the federal environmental review process fix problems with prior process, maintain environmental rigor, and accelerate needed infrastructure improvements.

Market Data | Jul 16, 2020
5 must reads for the AEC industry today: July 16, 2020
1928 hotel reimagined as a new resiential and cultural hub and Walgreens plans hundreds of doctor's offices at its stores.

Market Data | Jul 10, 2020
5 must reads for the AEC industry today: July 10, 2020
The world's tallest hybrid timber tower and the Florida Gators have a new $65 million ballpark.

Market Data | Jul 9, 2020
6 must reads for the AEC industry today: July 9, 2020
The world's most sustainable furniture factory and what will construction look like when COVID-19 ends?
Market Data | Jul 8, 2020
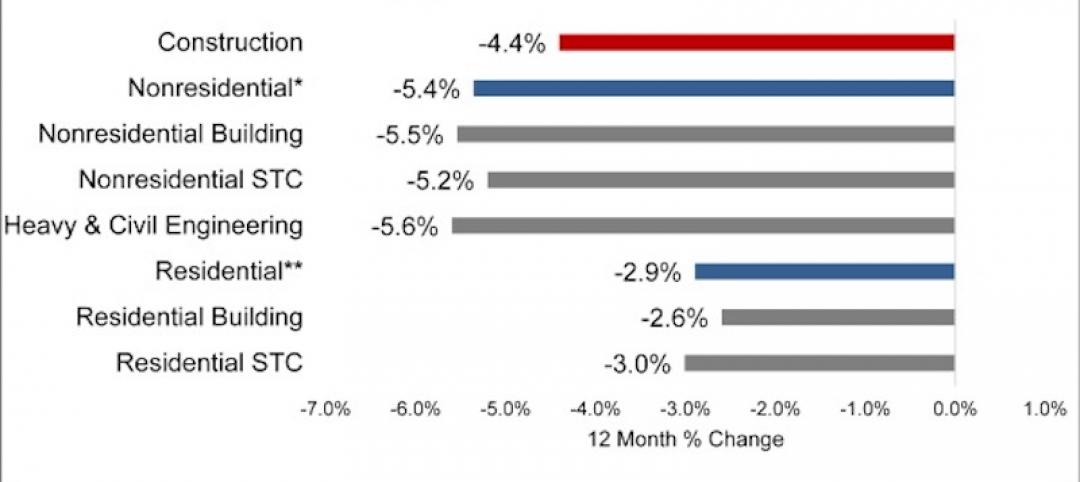
North America’s construction output to fall by 6.5% in 2020, says GlobalData
Even though all construction activities have been allowed to continue in most parts of the US and Canada since the start of the COVID-19 pandemic, many projects in the bidding or final planning stages have been delayed or canceled.
Market Data | Jul 8, 2020
5 must reads for the AEC industry today: July 8, 2020
AEMSEN develops concept for sustainable urban living and nonresidential construction has recovered 56% of jobs lost since March.
Market Data | Jul 7, 2020
Nonresidential construction has recovered 56% of jobs lost since March employment report
Nonresidential construction employment added 74,700 jobs on net in June.

Market Data | Jul 7, 2020
7 must reads for the AEC industry today: July 7, 2020
Construction industry adds 158,000 workers in June and mall owners open micro distribution hubs for e-commerce fulfillment.


