

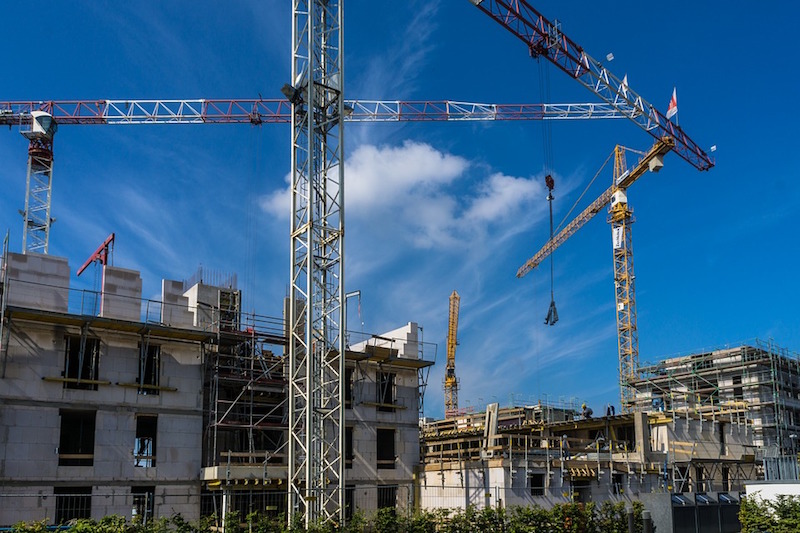
After seven months of steady growth in the demand for design services, the Architecture Billings Index (ABI) paused in September. As a leading economic indicator of construction activity, the ABI reflects the approximate nine to twelve month lead time between architecture billings and construction spending. The American Institute of Architects (AIA) reported the September ABI score was 49.1, down from a score of 53.7 in the previous month. This score reflects a slight decrease in design services provided by U.S. architecture firms (any score above 50 indicates an increase in billings). The new projects inquiry index was 59.0, down from a reading of 62.5 the previous month, while the new design contracts index eased somewhat from 54.2 to 52.9.
You can view this press release online here.
“We’ve seen unexpectedly strong numbers in design activity for most of 2017, so the pause in September should be viewed in that context” said AIA Chief Economist, Kermit Baker, Hon. AIA, PhD. “Project inquiries and new design contracts remain healthy, and the continued strength in most sectors and regions indicates stability industry-wide.”
Key September ABI highlights:
- Regional averages: Northeast (56.9), South (54.0), Midwest (50.4), West (48.8)
- Sector index breakdown: commercial / industrial (54.0), mixed practice (52.2), multi-family residential (51.0), institutional (51.0)
- Project inquiries index: 59.0
- Design contracts index: 52.9
The regional and sector categories are calculated as a 3-month moving average, whereas the national index, design contracts and inquiries are monthly numbers.
Related Stories

Market Data | Jan 5, 2016
Majority of AEC firms saw growth in 2015, remain optimistic for 2016: BD+C survey
By all indications, 2015 was another solid year for U.S. architecture, engineering, and construction firms.
Market Data | Jan 5, 2016
Nonresidential construction spending falters in November
Only 4 of 16 subsectors showed gains

Market Data | Dec 15, 2015
AIA: Architecture Billings Index hits another bump
Business conditions show continued strength in South and West regions.

Market Data | Dec 7, 2015
2016 forecast: Continued growth expected for the construction industry
ABC forecasts growth in nonresidential construction spending of 7.4% in 2016 along with growth in employment and backlog.


