


The Architecture Billings Index (ABI) recorded its seventh consecutive positive month, according to a new report today from The American Institute of Architects (AIA).
The ABI score for August was 55.6, up from July’s score of 54.6. Any score above 50 indicates an increase in billings from the prior month. During August, scoring for both the new project inquiries and design contracts moderated slightly but remained in positive territory, posting scores of 64.7 and 56.6 respectively.
“The surge in design activity continued in August, signifying an expected upturn in construction activity in the fourth quarter and continuing into 2022,” said AIA Chief Economist, Kermit Baker, Hon. AIA, PhD. “This expected expansion will magnify the already serious problems of price inflation and availability of many construction products and materials, as well as the emerging labor shortages in the industry.”
Key ABI highlights for August include:
- Regional averages: West (57.2); Midwest (55.2); South (52.5); Northeast (51.7)
- Sector index breakdown: mixed practice (56.0); commercial/industrial (54.7); institutional (54.4); multi-family residential (54.3)
The regional and sector categories are calculated as a three-month moving average, whereas the national index, design contracts and inquiries are monthly numbers.
To learn more about recent economic developments impacting design and construction, visit AIA’s website.
Related Stories

Market Data | Jun 2, 2020
Architects, health experts release strategies, tools for safely reopening buildings
AIA issues three new and enhanced tools for reducing risk of COVID-19 transmission in buildings.

Market Data | Jun 2, 2020
5 must reads for the AEC industry today: June 2, 2020
New Luxembourg office complex breaks ground and nonresidential construction spending falls.
Market Data | Jun 1, 2020
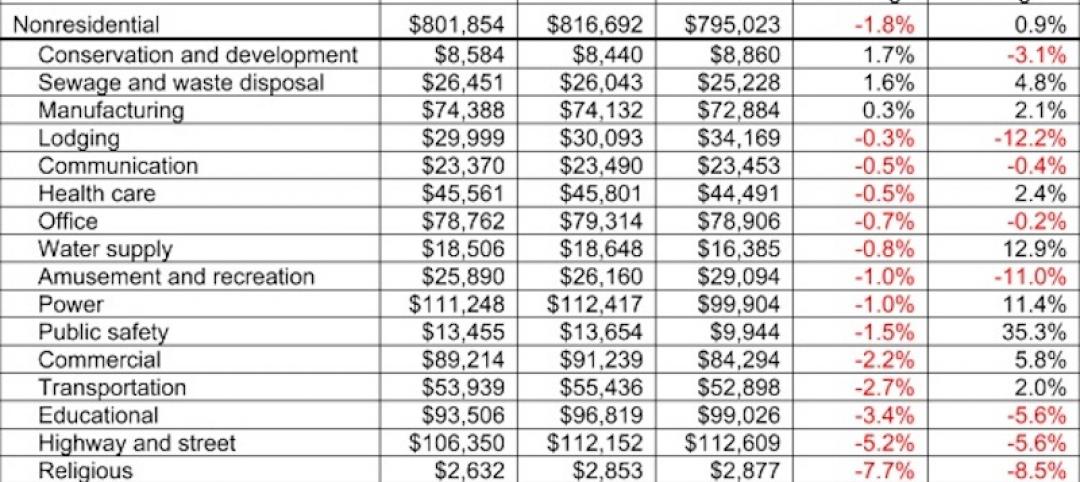
Nonresidential construction spending falls in April
Of the 16 subcategories, 13 were down on a monthly basis.
Market Data | Jun 1, 2020
7 must reads for the AEC industry today: June 1, 2020
Energy storage as an amenity and an entry-point for wellness screening everywhere.

Market Data | May 29, 2020
House-passed bill making needed improvements to paycheck protection program will allow construction firms to save more jobs
Construction official urges senate and White House to quickly pass and sign into law the Paycheck Protection Program Flexibility Act.

Market Data | May 29, 2020
7 must reads for the AEC industry today: May 29, 2020
Using lighting IoT data to inform a safer office reentry strategy and Ghafari joins forces with Eview 360.

Market Data | May 27, 2020
5 must reads for the AEC industry today: May 28, 2020
Biophilic design on the High Line and the office market could be a COVID-19 casualty.

Market Data | May 27, 2020
6 must reads for the AEC industry today: May 27, 2020
AIA's COTE Top Ten Awards and OSHA now requires employers to track COVID-19 cases.

Market Data | May 26, 2020
6 must reads for the AEC industry today: May 26, 2020
Apple's new Austin hotel and is CLT really a green solution?

Market Data | May 21, 2020
7 must reads for the AEC industry today: May 21, 2020
'Creepy' tech invades post-pandemic offices, and meet the new darling of commercial real estate.


