


The recent evolution of airport terminals has been prompted largely by different patterns of passenger behavior in a post-9/11 world. Passengers have learned get to the airport earlier. They spend less time browsing pre-security retail, opting to queue up in often-lengthy security lines well before boarding. The result? Overcrowding in post-security areas, where retail and dining options have historically been lacking.
Curtis Fentress, Principal-in-Charge of design at Fentress Architects, says greater passenger volume has strained gate and restroom capabilities. In addition, the recent popularity of low-cost airlines has increased demand for post-security dining options.
“Many carriers don’t provide any food on the airplane,” Fentress says. “So the people who are getting to the airport earlier to make sure they get through security are waiting, and they want something to eat. If there’s any kind of flight delay, they know they might be stuck in the airport or stuck up in the air for a while without any food.”
Airports are scrambling to respond with renovations and new terminals, even as they deal with TSA rules that can change in an instant. From CTX scanners—van-sized x-ray machines used to examine checked bags—to passenger scanners, the range of large equipment that terminals must accommodate just keeps morphing. Building Teams and their clients are adopting structural tactics that support change.
“We’re using more steel, which allows us to make longer distances between columns,” Fentress says. “The more long-span construction you can do, the more flexibility you have in the future.”
Top Air Terminal Sector Architecture Firms
| Rank | Company | 2013 Air Terminal Revenue Revenue |
| 1 | HOK | $47,074,837 |
| 2 | Gensler | 35,675,000 |
| 3 | Kohn Pedersen Fox Associates | 30,792,300 |
| 4 | Corgan | 26,376,420 |
| 5 | Fentress Architects | 26,333,785 |
| 6 | Stantec | 22,650,631 |
| 7 | RS&H | 22,050,000 |
| 8 | Skidmore, Owings & Merrill | 20,454,225 |
| 9 | PGAL | 17,120,000 |
| 10 | Heery International | 13,057,793 |
| 11 | HNTB Corp. | 10,900,639 |
| 12 | Leo A Daly | 9,490,737 |
| 13 | Gresham, Smith and Partners | 6,733,000 |
| 14 | SchenkelShultz Architecture | 6,179,000 |
| 15 | HKS | 4,087,622 |
| 16 | LS3P | 3,282,241 |
| 17 | Morris Architects | 2,795,000 |
| 18 | Clark Nexsen | 2,214,183 |
| 19 | Solomon Cordwell Buenz | 1,700,000 |
| 20 | CTA Architects Engineers | 1,187,913 |
| 21 | ZGF Architects | 929,658 |
| 22 | BRPH | 925,000 |
| 23 | Epstein | 762,000 |
| 24 | RTKL Associates | 677,000 |
| 25 | Integrus Architecture | 641,695 |
| 26 | Ware Malcomb | 196,500 |
| 27 | Rosser International | 158,668 |
| 28 | JRS Architect | 135,000 |
| 29 | Environetics | 112,443 |
| 30 | Parkhill, Smith & Cooper | 92,000 |
| 31 | Cuningham Group Architecture | 44,964 |
| 32 | Beyer Blinder Belle | 9,544 |
| 33 | Perkins+will | 6,836 |
| 34 | Ratio Architects | 5,368 |
Top Air Terminal Sector Engineering Firms
| Rank | Company | 2013 Air Terminal Revenue Revenue |
| 1 | Jacobs | $118,990,000 |
| 2 | URS Corp. | 83,069,612 |
| 3 | Burns & McDonnell | 48,010,000 |
| 4 | Parsons Brinckerhoff | 27,025,899 |
| 5 | Arup | 21,447,760 |
| 6 | Leidos | 16,810,000 |
| 7 | Ross & Baruzzini | 12,814,720 |
| 8 | AECOM Technology Corp. | 9,630,000 |
| 9 | STV | 5,260,000 |
| 10 | WSP Group | 3,640,000 |
| 11 | KPFF Consulting Engineers | 3,125,000 |
| 12 | Syska Hennessy Group | 2,933,760 |
| 13 | TLC Engineering for Architecture | 1,984,605 |
| 14 | TTG | 1,653,250 |
| 15 | Thornton Tomasetti | 1,620,411 |
| 16 | Walter P Moore and Associates | 1,596,212 |
| 17 | Sparling | 1,583,537 |
| 18 | Stanley Consultants | 1,526,482 |
| 19 | Aon Fire Protection Engineering Corp. | 1,500,000 |
| 20 | Graef | 1,267,799 |
| 21 | RMF Engineering | 1,200,000 |
| 22 | Coffman Engineers | 1,139,884 |
| 23 | Magnusson Klemencic Associates | 1,068,015 |
| 24 | RDK Engineers | 870,000 |
| 25 | Vanderweil Engineers | 856,900 |
| 26 | Wiss, Janney, Elstner Associates | 550,000 |
| 27 | Simpson Gumpertz & Heger | 550,000 |
| 28 | Martin/Martin | 494,691 |
| 29 | M-E Engineers | 400,000 |
| 30 | Newcomb & Boyd | 351,932 |
| 31 | Zak Companies | 351,488 |
| 32 | I. C. Thomasson Associates | 300,000 |
| 33 | Davis, Bowen & Friedel | 257,524 |
| 34 | Guernsey | 252,705 |
| 35 | Environmental Systems Design | 198,068 |
| 36 | CTLGroup | 180,000 |
| 37 | Joseph R. Loring & Associates | 175,000 |
| 38 | Heapy Engineering | 172,189 |
| 39 | Barge Waggoner Sumner & Cannon | 150,000 |
| 40 | GRW | 138,862 |
| 41 | Wallace Engineering | 131,000 |
| 42 | Dunham Associates | 90,000 |
| 43 | CJL Engineering | 81,400 |
| 44 | KJWW Engineering Consultants | 81,358 |
| 45 | P2S Engineering | 50,418 |
| 46 | Smith Seckman Reid | 44,419 |
| 47 | Bridgers & Paxton Consulting Engineers | 38,111 |
| 48 | Spectrum Engineers | 16,993 |
| 49 | Brinjac Engineering | 12,515 |
| 50 | French & Parrello Associates | 9,215 |
| 51 | AKF Group | 6,000 |
Top Air Terminal Sector Construction Firms
| Rank | Company | 2013 Air Terminal Revenue Revenue |
| 1 | Turner Construction | $487,680,000 |
| 2 | Hensel Phelps | 418,780,000 |
| 3 | PCL Construction | 328,069,635 |
| 4 | Walsh Group, The | 315,399,703 |
| 5 | Austin Commercial | 267,162,953 |
| 6 | Suffolk Construction | 170,270,605 |
| 7 | Balfour Beatty US | 154,058,403 |
| 8 | Clark Group | 131,741,104 |
| 9 | McCarthy Holdings | 127,000,000 |
| 10 | Manhattan Construction | 119,660,000 |
| 11 | Hunt Construction Group | 109,000,000 |
| 12 | URS Corp. | 83,069,612 |
| 13 | Hill International | 55,000,000 |
| 14 | Flintco | 54,400,000 |
| 15 | Walbridge | 46,000,000 |
| 16 | Skanska USA | 45,635,393 |
| 17 | Lend Lease | 35,107,000 |
| 18 | Weitz Company, The | 33,745,047 |
| 19 | HITT Contracting | 27,200,000 |
| 20 | Parsons Brinckerhoff | 27,025,899 |
| 21 | Brasfield & Gorrie | 25,926,312 |
| 22 | Gilbane | 22,031,250 |
| 23 | Tutor Perini Corp. | 19,320,308 |
| 24 | New South Construction | 18,923,000 |
| 25 | BlueScope Construction | 18,631,283 |
| 26 | O'Neil Industries/W.E. O'Neil | 18,433,037 |
| 27 | Holder Construction | 13,132,000 |
| 28 | Heery International | 13,057,793 |
| 29 | Yates Companies, The | 12,900,000 |
| 30 | Whiting-Turner Contracting Co., The | 11,991,159 |
| 31 | Beck Group, The | 11,096,174 |
| 32 | EMJ Corp. | 10,000,000 |
| 33 | James McHugh Construction | 9,527,392 |
| 34 | Robins & Morton | 6,370,178 |
| 35 | Messer Construction | 5,994,758 |
| 36 | W. M. Jordan Company | 5,812,917 |
| 37 | STV | 5,260,000 |
| 38 | Hill & Wilkinson | 4,766,000 |
| 39 | Consigli Construction | 3,278,099 |
| 40 | Kraus-Anderson Construction | 3,000,000 |
| 41 | Sundt Construction | 1,564,147 |
| 42 | JE Dunn Construction | 1,239,884 |
| 43 | Hoffman Construction | 1,000,000 |
| 44 | Hoar Construction | 4,000 |
Read BD+C's full 2014 Giants 300 Report
Related Stories

| Nov 14, 2014
JetBlue opens Gensler-designed International Concourse at JFK
The 175,000-sf extension includes the conversion of three existing gates to international swing gates, and the addition of three new international swing gates.
Sponsored | | Nov 12, 2014
Eye-popping façade highlights renovation, addition at Chaffin Junior High School
The new distinctive main entrance accentuates the public face of the school with an aluminum tube “baguette” system.

| Oct 26, 2014
New York initiates design competition for upgrading LaGuardia, Kennedy airports
New York Gov. Andrew Cuomo said that the state would open design competitions to fix and upgrade New York City’s aging airports. But financing construction is still unsettled.

| Oct 16, 2014
Perkins+Will white paper examines alternatives to flame retardant building materials
The white paper includes a list of 193 flame retardants, including 29 discovered in building and household products, 50 found in the indoor environment, and 33 in human blood, milk, and tissues.

| Oct 12, 2014
AIA 2030 commitment: Five years on, are we any closer to net-zero?
This year marks the fifth anniversary of the American Institute of Architects’ effort to have architecture firms voluntarily pledge net-zero energy design for all their buildings by 2030.

| Sep 24, 2014
Architecture billings see continued strength, led by institutional sector
On the heels of recording its strongest pace of growth since 2007, there continues to be an increasing level of demand for design services signaled in the latest Architecture Billings Index.
| Sep 22, 2014
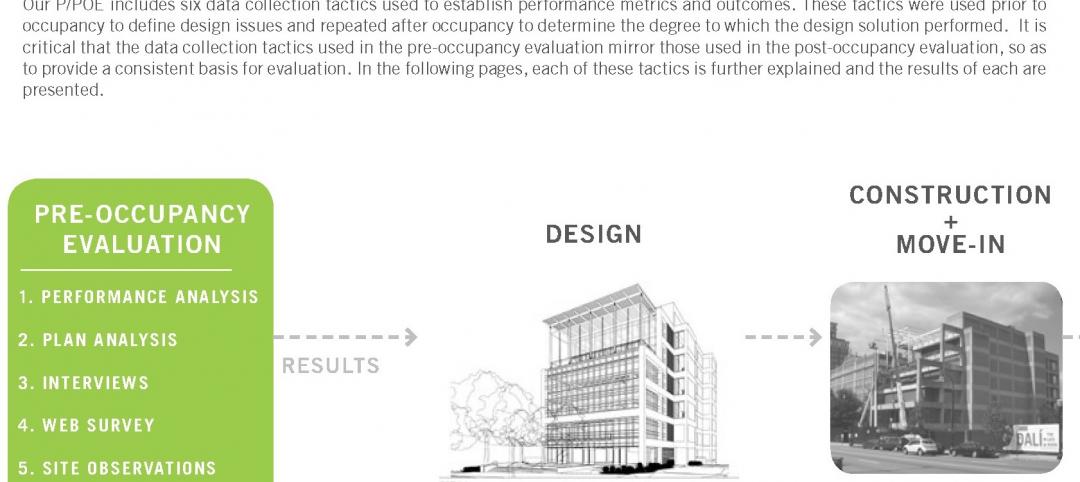
4 keys to effective post-occupancy evaluations
Perkins+Will's Janice Barnes covers the four steps that designers should take to create POEs that provide design direction and measure design effectiveness.
| Sep 22, 2014
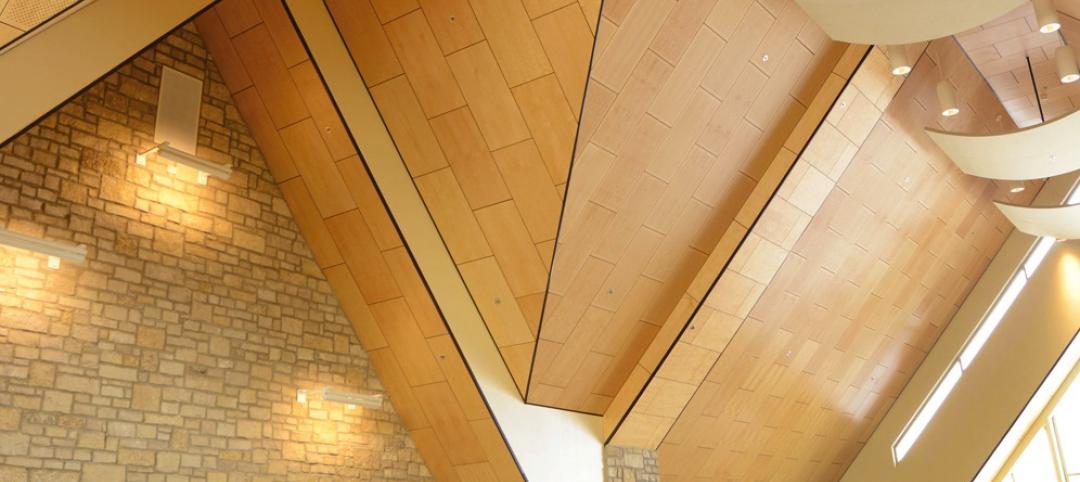
Sound selections: 12 great choices for ceilings and acoustical walls
From metal mesh panels to concealed-suspension ceilings, here's our roundup of the latest acoustical ceiling and wall products.

| Sep 15, 2014
Ranked: Top international AEC firms [2014 Giants 300 Report]
Parsons Brinckerhoff, Gensler, and Jacobs top BD+C's rankings of U.S.-based design and construction firms with the most revenue from international projects, as reported in the 2014 Giants 300 Report.

| Sep 9, 2014
Using Facebook to transform workplace design
As part of our ongoing studies of how building design influences human behavior in today’s social media-driven world, HOK’s workplace strategists had an idea: Leverage the power of social media to collect data about how people feel about their workplaces and the type of spaces they need to succeed.


