


The Architecture Billings Index (ABI), produced by the AIA Economics & Market Research Group, is a leading economic indicator that provides an approximately nine- to twelve-month glimpse into the future of nonresidential construction spending activity. The diffusion indexes contained in the full report are derived from a monthly “work-on-the-boards” survey that is sent to a panel of AIA member-owned firms.
Participants are asked whether their billings increased, decreased, or stayed the same in the month that just ended as compared to the prior month, and the results are then compiled into the ABI. These monthly results are also seasonally adjusted to allow for comparison to prior months. The monthly ABI index scores are centered around 50, with scores above 50 indicating an aggregate increase in billings, and scores below 50 indicating a decline.
Following a generally positive performance in 2015, the Architecture Billings Index has begun this year modestly dipping back into negative terrain. The AIA reported the January ABI score was 49.6, down slightly from the mark of 51.3 in the previous month. This score reflects a minor decrease in design services (any score above 50 indicates an increase in billings). The new projects inquiry index was 55.3, down from a reading of 60.5 the previous month.
“The fundamentals are mostly sound in the nonresidential design and construction market,” said AIA Chief Economist, Kermit Baker, Hon. AIA, PhD. “January was a rocky month throughout the economy, with falling oil prices, international economic concerns, and with steep declines in stock market valuations in the U.S. and elsewhere. Some of the fallout of this uncertainty may have affected progress on design projects.”
Key January* ABI highlights:
- Regional averages: West (50.8), Northeast (50.4), South (50.3), Midwest (48.9),
- Sector index breakdown: multifamily residential (51.9), commercial / industrial (50.5), institutional (49.9), mixed practice (49.0)
- Project inquiries index: 55.3
- Design contracts index: 50.9
The regional and sector categories are calculated as a 3-month moving average, whereas the national index, design contracts and inquiries are monthly numbers.
* Every January the AIA research department updates the seasonal factors used to calculate the ABI, resulting in a revision of recent ABI values.
Related Stories

Contractors | Jun 13, 2023
The average U.S. contractor has 8.9 months worth of construction work in the pipeline, as of May 2023
Associated Builders and Contractors reported that its Construction Backlog Indicator remained unchanged at 8.9 months in May, according to an ABC member survey conducted May 20 to June 7. The reading is 0.1 months lower than in May 2022. Backlog in the infrastructure category ticked up again and has now returned to May 2022 levels. On a regional basis, backlog increased in every region but the Northeast.
Industry Research | Jun 13, 2023
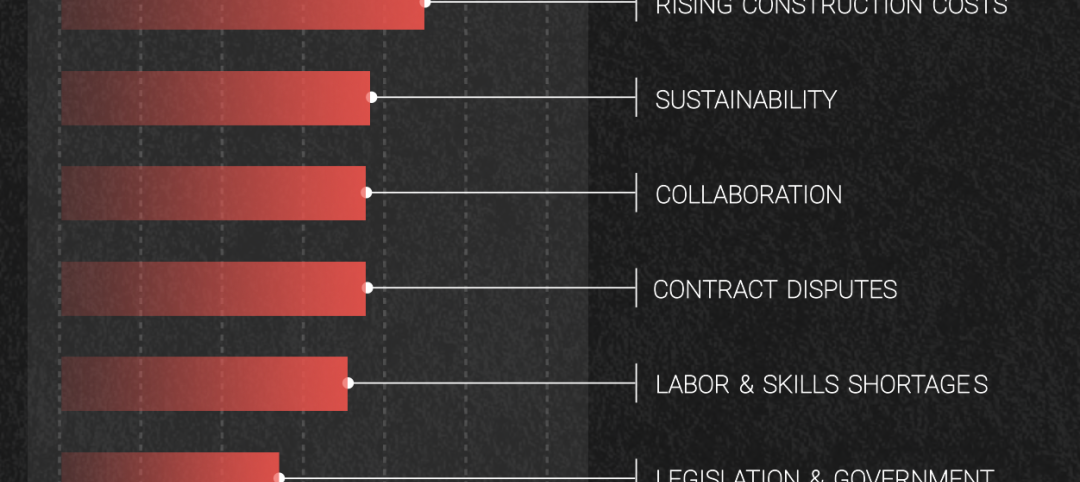
Two new surveys track how the construction industry, in the U.S. and globally, is navigating market disruption and volatility
The surveys, conducted by XYZ Reality and KPMG International, found greater willingness to embrace technology, workplace diversity, and ESG precepts.
| Jun 5, 2023
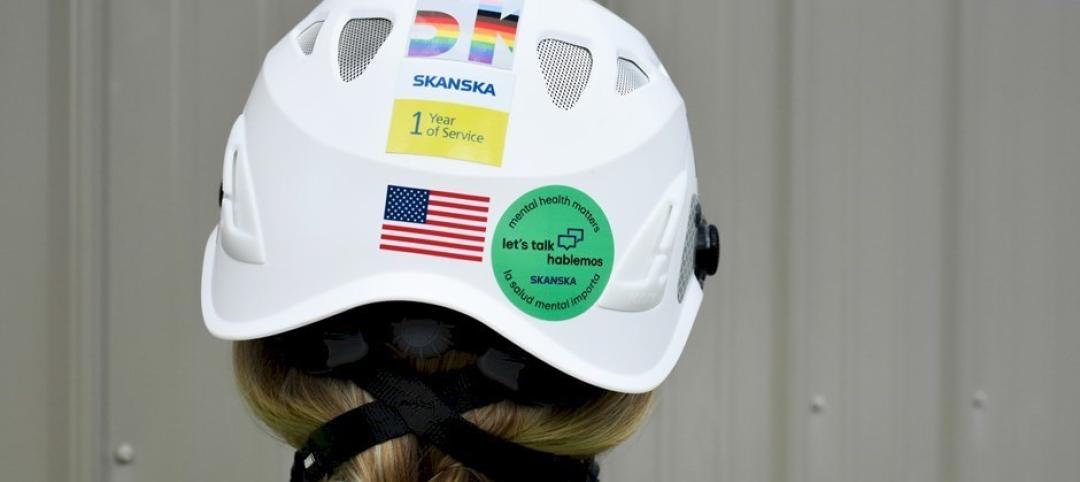
Communication is the key to AEC firms’ mental health programs and training
The core of recent awareness efforts—and their greatest challenge—is getting workers to come forward and share stories.

Contractors | May 24, 2023
The average U.S. contractor has 8.9 months worth of construction work in the pipeline, as of April 2023
Contractor backlogs climbed slightly in April, from a seven-month low the previous month, according to Associated Builders and Contractors.

Multifamily Housing | May 23, 2023
One out of three office buildings in largest U.S. cities are suitable for residential conversion
Roughly one in three office buildings in the largest U.S. cities are well suited to be converted to multifamily residential properties, according to a study by global real estate firm Avison Young. Some 6,206 buildings across 10 U.S. cities present viable opportunities for conversion to residential use.

Industry Research | May 22, 2023
2023 High Growth Study shares tips for finding success in uncertain times
Lee Frederiksen, Managing Partner, Hinge, reveals key takeaways from the firm's recent High Growth study.

Multifamily Housing | May 8, 2023
The average multifamily rent was $1,709 in April 2023, up for the second straight month
Despite economic headwinds, the multifamily housing market continues to demonstrate resilience, according to a new Yardi Matrix report.

Market Data | May 2, 2023
Nonresidential construction spending up 0.7% in March 2023 versus previous month
National nonresidential construction spending increased by 0.7% in March, according to an Associated Builders and Contractors analysis of data published today by the U.S. Census Bureau. On a seasonally adjusted annualized basis, nonresidential spending totaled $997.1 billion for the month.

Hotel Facilities | May 2, 2023
U.S. hotel construction up 9% in the first quarter of 2023, led by Marriott and Hilton
In the latest United States Construction Pipeline Trend Report from Lodging Econometrics (LE), analysts report that construction pipeline projects in the U.S. continue to increase, standing at 5,545 projects/658,207 rooms at the close of Q1 2023. Up 9% by both projects and rooms year-over-year (YOY); project totals at Q1 ‘23 are just 338 projects, or 5.7%, behind the all-time high of 5,883 projects recorded in Q2 2008.

Market Data | May 1, 2023
AEC firm proposal activity rebounds in the first quarter of 2023: PSMJ report
Proposal activity for architecture, engineering and construction (A/E/C) firms increased significantly in the 1st Quarter of 2023, according to PSMJ’s Quarterly Market Forecast (QMF) survey. The predictive measure of the industry’s health rebounded to a net plus/minus index (NPMI) of 32.8 in the first three months of the year.


