


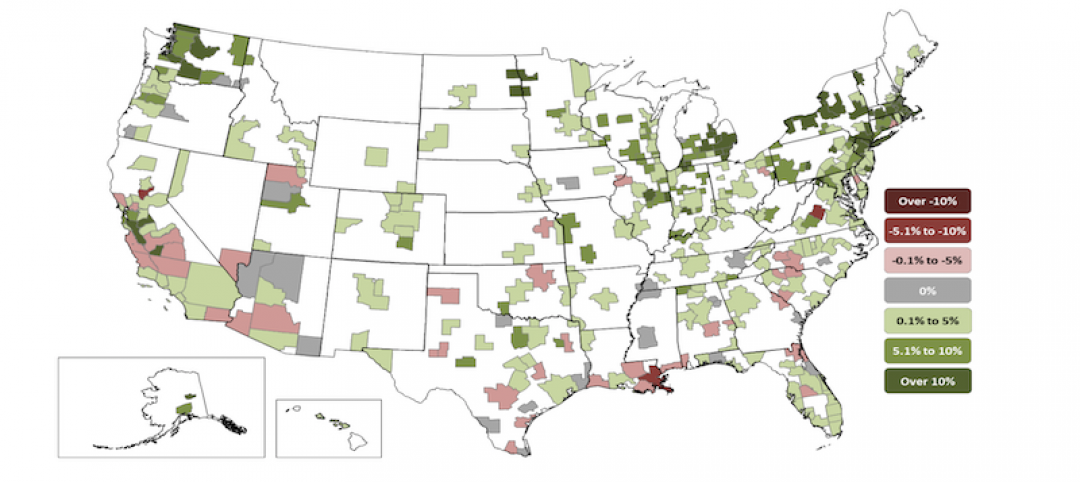
The Architecture Billings Index saw a dip into negative terrain for the first time in five months in January, but inched back up in February with a small increase in demand for design services.
As a leading economic indicator of construction activity, the ABI reflects the approximate nine to twelve month lead time between architecture billings and construction spending. The American Institute of Architects (AIA) reported the February ABI score was 50.3, up slightly from the mark of 49.6 in the previous month. This score reflects a minor increase in design services (any score above 50 indicates an increase in billings). The new projects inquiry index was 59.5, up from a reading of 55.3 the previous month.
“March and April are traditionally the busiest months for architecture firms, so we should get a clearer reading of underlying momentum over the next couple of months,” said AIA Chief Economist, Kermit Baker, Hon. AIA, PhD. “Hopefully the relatively mild weather conditions recently in most parts of the country will help design and construction activity move ahead at a somewhat faster pace.”
Key February ABI highlights:
- Regional averages: South (51.1), West (49.9), Northeast (49.5), Midwest (49.3)
- Sector index breakdown: multi-family residential (53.0), commercial / industrial (52.3), institutional (48.1), mixed practice (47.7)
- Project inquiries index: 59.5
- Design contracts index: 51.7
The regional and sector categories are calculated as a 3-month moving average, whereas the national index, design contracts and inquiries are monthly numbers.
Related Stories
Market Data | Jul 29, 2020
62% of metros shed construction jobs from June 2019 to June 2020 as Association calls for new infrastructure funding, other relief steps
New York City and Brockton-Bridgewater-Easton, Mass. have worst 12-month losses, while Austin and Walla Walla, Wash. top job gainers.

Market Data | Jul 29, 2020
6 must reads for the AEC industry today: July 29, 2020
The world's first net-zero airport and California utility adopts climate emergency declaration.

Market Data | Jul 28, 2020
For the fourth consecutive quarter, Los Angeles leads the U.S. hotel construction pipeline at the close of Q2’ 20
New York City continues to have the greatest number of projects under construction, with 106 projects/18,354 rooms.

Market Data | Jul 28, 2020
6 must reads for the AEC industry today: July 28, 2020
St. Petersburg Pier reconstruction completes and post-pandemic workplace design will not be the same for all.

Market Data | Jul 28, 2020
Senate Republicans' coronavirus relief measure includes provisions that will help hard-hit construction firms recover
The HEALS Act includes essential liability, workforce, financial & unemployment reforms, but association will work to get needed infrastructure investments included in final relief measure.

Market Data | Jul 27, 2020
6 must reads for the AEC industry today: July 27, 2020
Customized labs give universities a recruiting edge and the U.S. construction pipeline remains robust through the first half of 2020.

Market Data | Jul 27, 2020
The U.S. construction pipeline remains robust through the first half of 2020, despite pandemic
Projects currently under construction stand at 1,771 projects/235,467 rooms, up 3% and 1% respectively, YOY.
Market Data | Jul 24, 2020
5 must reads for the AEC industry today: July 24, 2020
North Carolina will stop relying on FEMA flood mapping and Cal Poly Pomona's newest project.

Market Data | Jul 23, 2020
New LEED guidance from USGBC helps cities and communities expand resilience efforts in response to the COVID-19 pandemic
Credits integrate public health and social equity with sustainability planning.

Market Data | Jul 23, 2020
6 must reads for the AEC industry today: July 23, 2020
Skanska selects Pickard Chilton to design new ofice tower and days grow long at nursing homes as virus lockdowns drag on.


