


Sports and recreation architects have always worked in close consultation with their clients, seeking answers to hundreds of questions about everything from the program’s biggest needs to the building’s smallest details. To that end, architects host charrettes, employ surveys, hold open forums and perform informal interviews with program administrators, maintenance staff, students and anyone else with a stake in the completed project.
All of these are helpful — some are vital — but, unfortunately, each are limited in scope. For example, a survey can help gauge student interest in particular activities or in raising their fees to pay for a facility, but a traditional survey can’t reach enough respondents or be of sufficient detail to give a full picture of the current (or desired) user experience.
Crowdsourcing, a term coined in 2006, is increasingly being employed to fill this gap using a variety of online tools and services, but to be effective, it requires the right survey instrument and a knowledgeable team of professionals to employ it — to create an effective survey, compile and analyze the data and, ideally, to integrate with other professionals and stakeholders to ensure that the knowledge gained by the exercise doesn’t fall between the cracks.
As one firm that has embraced crowdsourcing as part of our broader data-driven efforts, we’re beginning to see applications for this type of approach far beyond what we envisioned when we first developed Sasaki Strategies, a group formalized in 2005 with the goal of creating a strong analytical function to support the firm’s planning and design work. On the heels of many successful deployments in city and campus planning, we’re now bringing crowdsourcing to bear on post-occupancy research, allowing our architects to better understand what aspects of their buildings are operating as they anticipated, and what areas can be improved in future designs. What we’re discovering is that there is no detail too small to be analyzed.
As an example, consider a very typical treatment in contemporary fitness centers. Daylight streams into the space through curtainwall and past a perimeter of fitness equipment, facing out. Designing and outfitting the space in this way simultaneously gives exercisers a dramatic view and animates the building from the outside, and also adheres to CPTED (crime prevention through environmental design) principles, ensuring that exterior pathways and parking lots are “policed” by fitness center users.
This is what an architect would tell you. Do you know what exercisers would tell you? If a large number of users told you that they don’t like exercising in full display of passersby, would that change the way you operated your facility? If you were an architect, would it change your approach to these facilities in the future?
Ask, And You Shall Receive
Sasaki’s internal think tank of programmers and analysts got its official “Strategies” designation about 10 years ago. The group has doubled in size in just the past three years to around nine full-time members, in concert with the development and rollout of its biggest technological breakthrough to date, an online interactive mapping program.
Bearing a flexible name (myCampus in campus planning, myCommunity in municipal and regional planning), each iteration of the program allows survey respondents to drag and drop multiple icons onto a graphic representation of a campus or streetscape and comment at any length about a particular location. Icons sporting different colors and graphics denote different topic areas, so that a viewer can see at a glance where the trouble spots (or favorite spaces) are. Typical icons in a campus planning mode might allow respondents to show areas of the campus where they do or do not feel safe, the routes on which they typically walk or the location of their preferred parking lots.
In one recent use of the tool, respondents at Harvard Kennedy School graphically illustrated for administrators how the campus’ “front door” was underutilized, helping the firm’s planners make the case for a future shift in campus orientation. myCampus is now associated with huge usage numbers on a number of campuses — as of this writing, more than 2,500 respondents at three different universities had each placed more than 40,000 icons on their respective campus maps, and an ongoing planning survey at Rutgers had topped 7,500 respondents.
Adapted for post-occupancy use, the myBuilding tool can include icons for larger-picture input (favorite hangout?) as well as much more granular topics: Too hot/cold; Amenities we wish we had; Room oversized/undersized; Confusing equipment or signage; Long waiting time. As with myCampus, the idea is to avoid tailoring the mapping questions, giving respondents free rein to drop icons wherever they please and add comments, as desired. And comment they do, sometimes at length, with some of the comments helpful for designers (UNDERSIZED: “For fencing, this room is just a little too narrow”) and some for owners (MISSING PIECE: “I wish we had larger mats to work out on. There is only one small mat in the back of the second floor, and it is usually overcrowded”).
After the mapping portion of the survey, respondents add traditional survey information that will offer opportunities to find splits in the data: class, gender, typical visit times, visit frequency, and any number of yes/no questions. In post-occupancy research, for example, we’d expect to always include two vital questions — Did this facility impact your decision to attend/stay at the university? — that can help recreation and university administrators quantify the building’s impact.
In a recent myBuilding post-occupancy survey, we also asked a series of questions for which respondents chose from a list of provided answers and were asked to rank them. How has the recreation center impacted you? In your opinion, what are the most important advantages of the facility’s location? What are the four most important aspects of your routine? For the owner, the goal in asking many of these questions is simply to better understand how people are using the space, with an eye toward better space management and space utilization tactics in the future, which then inform improved capital allocation decisions.
But the potential benefits are even greater, once different data sets are put together. A tool such as MyBuilding and myCampus allows administrators to merge mission-based planning, financial planning and physical planning so that these things that have traditionally been done on separate tracks get to inform one another and lead to better results.
Analyze This
Our adaptation of myCampus to post-occupancy research has come with only one hiccup — while an increasing number of university administrators have shown a willingness to grant access to student contact information when an exciting new construction project is in development, they appear to be less inclined to invite student involvement after a building has been completed. The obvious danger of only authorizing building users, or even a small subset of building users, to take part in a survey is self-selection bias — and in any case, it flies in the face of the very concept of crowdsourcing.
Thus far, faculty, staff and students who have used myBuilding are providing a lot of excitement — facility users enjoy the tool’s interactive and freeform nature — as well as data on facility management and operations that is invaluable to rec center owners. Both users and administrators have a stake in how a building can be programmed to meet demand, or how to bring in fringe groups to get excited about exercise. Respondents are not shy about getting involved and offering their opinions on these and other matters.
In the past, it wasn’t easy to get people excited about filling out surveys, and the data was difficult to compile and massage. Open forums and other face-to-face meetings netted a small amount of information that tended to be skewed, since the tendency was to err on the side of whomever in the room spoke the loudest or most passionately. We still see MyBuilding and myCampus as augmenting these other traditional methods, but it is easy to imagine crowdsourcing methods crowding out other forms of information gathering.
The ability to ask questions of a very large group of people using an interactive tool that gives them free rein to expand on their opinions anonymously sometimes elicits answers, comments, complaints and ideas that we never anticipated. Simply by asking general questions about how people use a particular space, we sometimes learn something really surprising that can inform us going forward. §
About the Author
Chris Sgarzi (csgarzi@sasaki.com) is a principal and leader of the sports practice at Sasaki Associates Inc. in Watertown, Mass.
Related Stories

Green | Aug 7, 2023
Rooftop photovoltaic panels credited with propelling solar energy output to record high
Solar provided a record-high 7.3% of U.S. electrical generation in May, “driven in large part by growth in ‘estimated’ small-scale (e.g., rooftop) solar PV whose output increased by 25.6% and accounted for nearly a third (31.9%) of total solar production,” according to a report by the U.S. Energy Information Administration.

Resiliency | Aug 7, 2023
Creative ways cities are seeking to beat urban heat gain
As temperatures in many areas hit record highs this summer, cities around the world are turning to creative solutions to cope with the heat. Here are several creative ways cities are seeking to beat urban heat gain.

Government Buildings | Aug 7, 2023
Nearly $1 billion earmarked for energy efficiency upgrades to federal buildings
The U.S. General Services Administration (GSA) recently announced plans to use $975 million in Inflation Reduction Act funding for energy efficiency and clean energy upgrades to federal buildings across the country. The investment will impact about 40 million sf, or about 20% of GSA’s federal buildings portfolio.
MFPRO+ New Projects | Aug 4, 2023
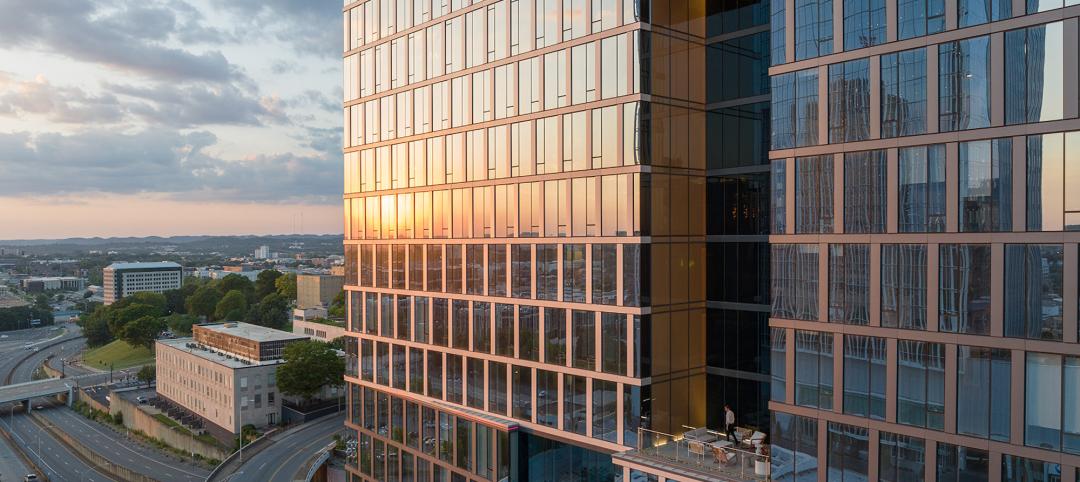
Nashville gets 'first-of-its-kind' residential tower
Global architecture firm Goettsch Partners announces the completion of Alcove, a new 356-unit residential tower in Nashville, Tenn., developed by Giarratana LLC.
Industrial Facilities | Aug 3, 2023
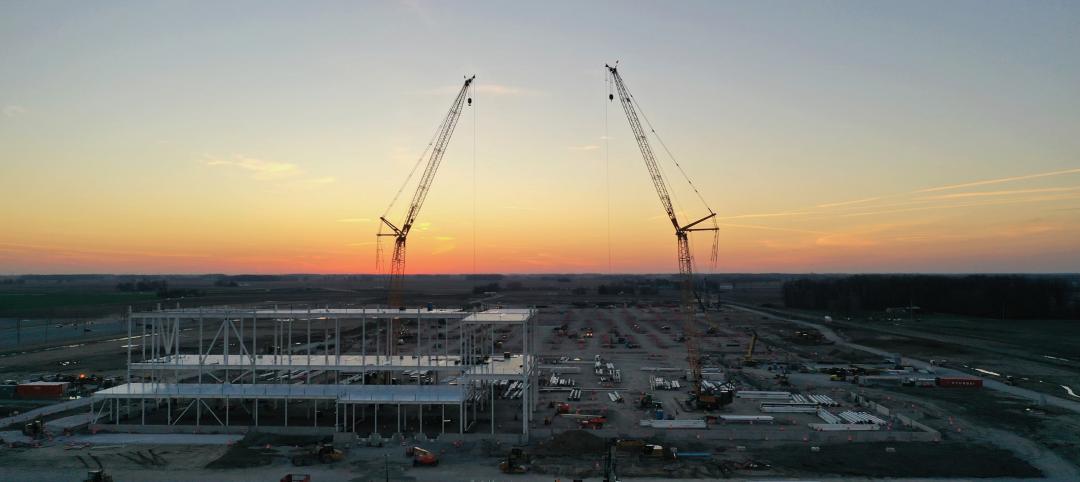
The state of battery manufacturing in the era of EV
One of the most significant changes seen in today’s battery plant is the full manufacturing process—from raw materials to the fully operational battery.

Government Buildings | Aug 2, 2023
A historic courthouse in Charlotte is updated and expanded by Robert A.M. Stern Architects
Robert A.M. Stern Architects’ design retains the original building’s look and presence.

Hotel Facilities | Aug 2, 2023
Top 5 markets for hotel construction
According to the United States Construction Pipeline Trend Report by Lodging Econometrics (LE) for Q2 2023, the five markets with the largest hotel construction pipelines are Dallas with a record-high 184 projects/21,501 rooms, Atlanta with 141 projects/17,993 rooms, Phoenix with 119 projects/16,107 rooms, Nashville with 116 projects/15,346 rooms, and Los Angeles with 112 projects/17,797 rooms.

Architects | Aug 1, 2023
Ware Malcomb announces hire of Jason Golub as Regional Director
In this role, Golub is responsible for the overall leadership and continued growth of the office.

Market Data | Aug 1, 2023
Nonresidential construction spending increases slightly in June
National nonresidential construction spending increased 0.1% in June, according to an Associated Builders and Contractors analysis of data published today by the U.S. Census Bureau. Spending is up 18% over the past 12 months. On a seasonally adjusted annualized basis, nonresidential spending totaled $1.07 trillion in June.

Healthcare Facilities | Aug 1, 2023
Top 10 healthcare design projects for 2023
The HKS-designed Allegheny Health Network Wexford (Pa.) Hospital and Flad Architects' Sarasota Memorial Hospital - Venice (Fla.) highlight 10 projects to win 2023 Healthcare Design Awards from the American Institute of Architects Academy of Architecture for Health.


