


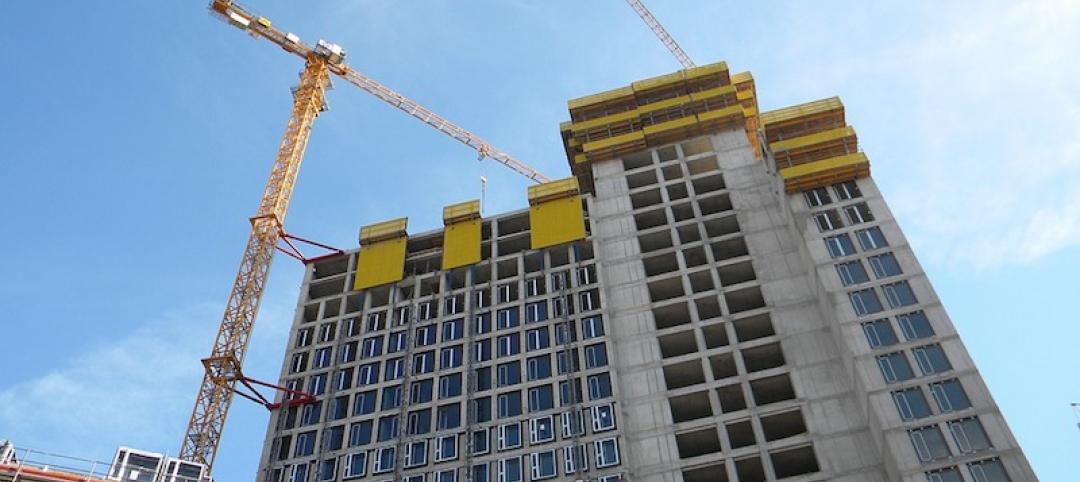
Associated Builders and Contractors (ABC) reports that its Construction Backlog Indicator (CBI) contracted to 8.8 months during the first quarter of 2018, down 9% from the prior quarter. CBI is down 2% on a year-over-year basis.
“The Construction Backlog Indicator hit an all-time high during the fourth quarter of 2017,” said ABC Chief Economist Anirban Basu. “A number of factors pushed backlog lower during the first quarter of 2018, including an extensive winter. Only one region has experienced a decline in backlog on a year-over-year basis: the Middle States, which encompasses the Upper Midwest. There also was a significant uptick in survey participation during the first quarter, which may have helped shape the result. In sum, average backlog remains lofty by historic standards.
“Given improved weather and normal seasonal factors, it is likely that backlog will bounce back during the second quarter. However, the level of improvement may be undermined by a combination of worker shortages and rapidly rising construction materials prices. Despite recent increases in the costs of delivering construction services due to rising human capital and materials costs, there is scant evidence of a decline in demand for construction services,” said Basu.

Highlights by Region
— Backlog in the South fell 8% during the first quarter, but remains 2.9% higher on a year-over-year basis. Large metropolitan areas such as Tampa, Fla., Atlanta, Dallas and Austin, Texas, continue to generate significant construction activity. Expect backlog to remain lengthy as communities impacted by last year’s storms continue to rebuild.
— Backlog in the Northeast fell after expanding for five consecutive quarters. Large cities along the northeast corridor continue to attract commercial investment, including the suburbs of Baltimore. Despite the first quarter decline in backlog, the region’s reading remains elevated by historical standards.
— Backlog in the Middle States is down 12.6% for the quarter (more than a full month) and 14.7% year over year. Weather played a role, but other factors are at work. Tariffs and threats of trade wars impact this region disproportionately given its central role in the nation’s industrial production.
— Backlog in the West surged to its highest level since mid-2014. Rebuilding from prior wildfires likely played a role, but the bigger reason relates to surging technology sectors in San Jose, Calif., San Francisco, Seattle, Portland, Ore., Los Angeles and San Diego.

Highlights by Industry
— Backlog in the commercial/institutional segment fell for the first time since the end of 2016. Despite the 8.8% quarterly decline, backlog in this segment remains 3.2% higher than the same time one year ago. However, this sector is vulnerable to further declines given its significant exposure to rising borrowing costs, higher materials prices and growing concerns regarding product saturation in a number of first-tier American real estate markets.
— Average backlog in the heavy industrial category rebounded during the first quarter, expanding 13.5%. Despite this sizable increase, the segment remains roughly unchanged at historically low levels on a year-over-year basis. Construction spending related to manufacturing has been drifting lower for months. While there have been some highly visible announcements regarding large capital projects in this segment, concerns regarding trade wars are likely to suppress backlog to a meaningful degree.
— Backlog in the infrastructure category drifted back to Earth during the first quarter, declining by more than two months from levels observed during the fourth quarter of 2017. This reading may have been impacted by a sharp increase in survey participation. Weather likely played an even larger role. The expectation is that backlog in this category will expand for the balance of the year as improving state and local government finances spur more investment in education, public safety, highway/street and other publicly financed categories.

Highlights by Company Size
— Large firms—those with annual revenues in excess of $100 million—experienced a sharp decline in backlog. This overlapped neatly with the decline in backlog related to infrastructure. Backlog for these large firms remains higher than any other classification considered in this release.
— Backlog among firms with annual revenues between $50 million and $100 million increased 0.4 months during the first quarter and currently stands at its second highest level since the series began in 2008. This group is heavily impacted by certain construction segments that have experienced little interruption in construction spending momentum.
— Firms with between $30 million and $50 million in annual revenues experienced a sharp decline in first quarter backlog. Enhanced survey participation likely explains part of this result. This group is significantly exposed to the energy sector, which stands to see an uptick in activity given recent trends in oil prices.
— Backlog for firms with annual revenues of less than $30 million increased 0.3 months during the first quarter and remains remarkable steady. This stability is likely the product of a dearth of available subcontractors to do electrical, mechanical, glass installation and other forms of work.
CBI is a leading economic indicator that reflects the amount of construction work under contract, but not yet completed. CBI is measured in months, with a lengthening backlog implying expanding demand for construction services. More CBI charts and graphs are available on abc.org.
Related Stories

Industry Research | Oct 25, 2016
New HOK/CoreNet Global report explores impact of coworking on corporate real rstate
“Although coworking space makes up less than one percent of the world’s office space, it represents an important workforce trend and highlights the strong desire of today’s employees to have workplace choices, community and flexibility,” says Kay Sargent, Director of WorkPlace at HOK.

Market Data | Oct 24, 2016
New construction starts in 2017 to increase 5% to $713 billion
Dodge Outlook Report predicts moderate growth for most project types – single family housing, commercial and institutional building, and public works, while multifamily housing levels off and electric utilities/gas plants decline.

High-rise Construction | Oct 21, 2016
The world’s 100 tallest buildings: Which architects have designed the most?
Two firms stand well above the others when it comes to the number of tall buildings they have designed.

Market Data | Oct 19, 2016
Architecture Billings Index slips consecutive months for first time since 2012
“This recent backslide should act as a warning signal,” said AIA Chief Economist, Kermit Baker.

Market Data | Oct 11, 2016
Building design revenue topped $28 billion in 2015
Growing profitability at architecture firms has led to reinvestment and expansion
Market Data | Oct 4, 2016
Nonresidential spending slips in August
Public sector spending is declining faster than the private sector.

Industry Research | Oct 3, 2016
Structure Tone survey shows cost is still a major barrier to building green
Climate change, resilience and wellness are also growing concerns.

Industry Research | Sep 27, 2016
Sterling Risk Sentiment Index indicates risk exposure perception remains stable in construction industry
Nearly half (45%) of those polled say election year uncertainty has a negative effect on risk perception in the construction market.

Market Data | Sep 22, 2016
Architecture Billings Index slips, overall outlook remains positive
Business conditions are slumping in the Northeast.

Market Data | Sep 20, 2016
Backlog skyrockets for largest firms during second quarter, but falls to 8.5 months overall
While a handful of commercial construction segments continue to be associated with expanding volumes, for the most part, the average contractor is no longer getting busier, says ABC Chief Economist Anirban Basu.


