


Associated Builders and Contractors (ABC) reports that its Construction Backlog Indicator (CBI) contracted to 8.8 months during the first quarter of 2018, down 9% from the prior quarter. CBI is down 2% on a year-over-year basis.
“The Construction Backlog Indicator hit an all-time high during the fourth quarter of 2017,” said ABC Chief Economist Anirban Basu. “A number of factors pushed backlog lower during the first quarter of 2018, including an extensive winter. Only one region has experienced a decline in backlog on a year-over-year basis: the Middle States, which encompasses the Upper Midwest. There also was a significant uptick in survey participation during the first quarter, which may have helped shape the result. In sum, average backlog remains lofty by historic standards.
“Given improved weather and normal seasonal factors, it is likely that backlog will bounce back during the second quarter. However, the level of improvement may be undermined by a combination of worker shortages and rapidly rising construction materials prices. Despite recent increases in the costs of delivering construction services due to rising human capital and materials costs, there is scant evidence of a decline in demand for construction services,” said Basu.

Highlights by Region
— Backlog in the South fell 8% during the first quarter, but remains 2.9% higher on a year-over-year basis. Large metropolitan areas such as Tampa, Fla., Atlanta, Dallas and Austin, Texas, continue to generate significant construction activity. Expect backlog to remain lengthy as communities impacted by last year’s storms continue to rebuild.
— Backlog in the Northeast fell after expanding for five consecutive quarters. Large cities along the northeast corridor continue to attract commercial investment, including the suburbs of Baltimore. Despite the first quarter decline in backlog, the region’s reading remains elevated by historical standards.
— Backlog in the Middle States is down 12.6% for the quarter (more than a full month) and 14.7% year over year. Weather played a role, but other factors are at work. Tariffs and threats of trade wars impact this region disproportionately given its central role in the nation’s industrial production.
— Backlog in the West surged to its highest level since mid-2014. Rebuilding from prior wildfires likely played a role, but the bigger reason relates to surging technology sectors in San Jose, Calif., San Francisco, Seattle, Portland, Ore., Los Angeles and San Diego.

Highlights by Industry
— Backlog in the commercial/institutional segment fell for the first time since the end of 2016. Despite the 8.8% quarterly decline, backlog in this segment remains 3.2% higher than the same time one year ago. However, this sector is vulnerable to further declines given its significant exposure to rising borrowing costs, higher materials prices and growing concerns regarding product saturation in a number of first-tier American real estate markets.
— Average backlog in the heavy industrial category rebounded during the first quarter, expanding 13.5%. Despite this sizable increase, the segment remains roughly unchanged at historically low levels on a year-over-year basis. Construction spending related to manufacturing has been drifting lower for months. While there have been some highly visible announcements regarding large capital projects in this segment, concerns regarding trade wars are likely to suppress backlog to a meaningful degree.
— Backlog in the infrastructure category drifted back to Earth during the first quarter, declining by more than two months from levels observed during the fourth quarter of 2017. This reading may have been impacted by a sharp increase in survey participation. Weather likely played an even larger role. The expectation is that backlog in this category will expand for the balance of the year as improving state and local government finances spur more investment in education, public safety, highway/street and other publicly financed categories.

Highlights by Company Size
— Large firms—those with annual revenues in excess of $100 million—experienced a sharp decline in backlog. This overlapped neatly with the decline in backlog related to infrastructure. Backlog for these large firms remains higher than any other classification considered in this release.
— Backlog among firms with annual revenues between $50 million and $100 million increased 0.4 months during the first quarter and currently stands at its second highest level since the series began in 2008. This group is heavily impacted by certain construction segments that have experienced little interruption in construction spending momentum.
— Firms with between $30 million and $50 million in annual revenues experienced a sharp decline in first quarter backlog. Enhanced survey participation likely explains part of this result. This group is significantly exposed to the energy sector, which stands to see an uptick in activity given recent trends in oil prices.
— Backlog for firms with annual revenues of less than $30 million increased 0.3 months during the first quarter and remains remarkable steady. This stability is likely the product of a dearth of available subcontractors to do electrical, mechanical, glass installation and other forms of work.
CBI is a leading economic indicator that reflects the amount of construction work under contract, but not yet completed. CBI is measured in months, with a lengthening backlog implying expanding demand for construction services. More CBI charts and graphs are available on abc.org.
Related Stories

Industry Research | Jun 15, 2023
Exurbs and emerging suburbs having fastest population growth, says Cushman & Wakefield
Recently released county and metro-level population growth data by the U.S. Census Bureau shows that the fastest growing areas are found in exurbs and emerging suburbs.

Contractors | Jun 13, 2023
The average U.S. contractor has 8.9 months worth of construction work in the pipeline, as of May 2023
Associated Builders and Contractors reported that its Construction Backlog Indicator remained unchanged at 8.9 months in May, according to an ABC member survey conducted May 20 to June 7. The reading is 0.1 months lower than in May 2022. Backlog in the infrastructure category ticked up again and has now returned to May 2022 levels. On a regional basis, backlog increased in every region but the Northeast.
Industry Research | Jun 13, 2023
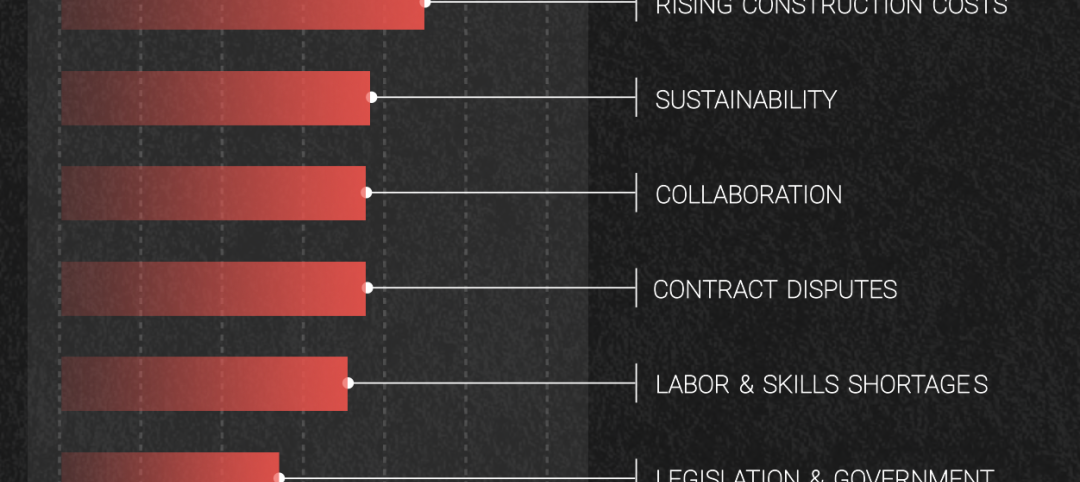
Two new surveys track how the construction industry, in the U.S. and globally, is navigating market disruption and volatility
The surveys, conducted by XYZ Reality and KPMG International, found greater willingness to embrace technology, workplace diversity, and ESG precepts.
| Jun 5, 2023
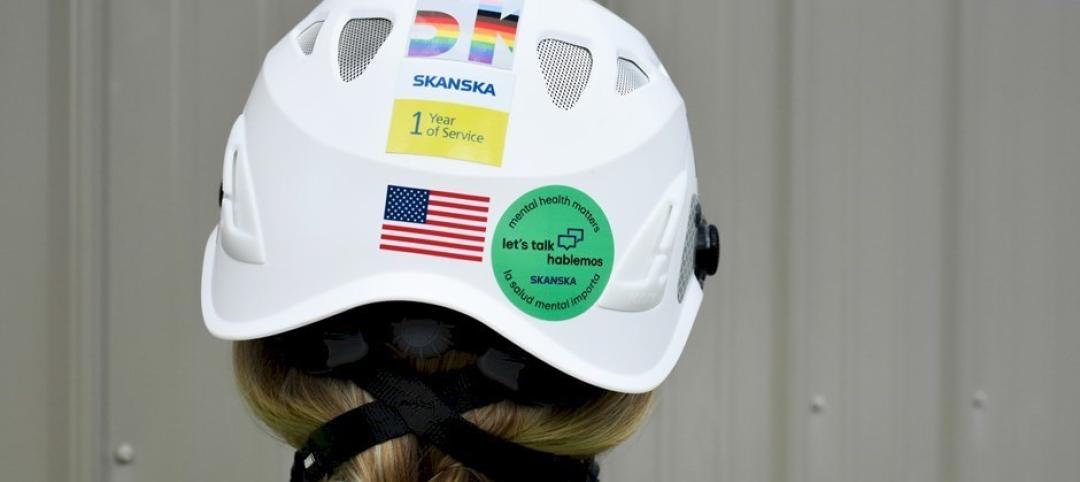
Communication is the key to AEC firms’ mental health programs and training
The core of recent awareness efforts—and their greatest challenge—is getting workers to come forward and share stories.

Contractors | May 24, 2023
The average U.S. contractor has 8.9 months worth of construction work in the pipeline, as of April 2023
Contractor backlogs climbed slightly in April, from a seven-month low the previous month, according to Associated Builders and Contractors.

Multifamily Housing | May 23, 2023
One out of three office buildings in largest U.S. cities are suitable for residential conversion
Roughly one in three office buildings in the largest U.S. cities are well suited to be converted to multifamily residential properties, according to a study by global real estate firm Avison Young. Some 6,206 buildings across 10 U.S. cities present viable opportunities for conversion to residential use.

Industry Research | May 22, 2023
2023 High Growth Study shares tips for finding success in uncertain times
Lee Frederiksen, Managing Partner, Hinge, reveals key takeaways from the firm's recent High Growth study.

Multifamily Housing | May 8, 2023
The average multifamily rent was $1,709 in April 2023, up for the second straight month
Despite economic headwinds, the multifamily housing market continues to demonstrate resilience, according to a new Yardi Matrix report.

Market Data | May 2, 2023
Nonresidential construction spending up 0.7% in March 2023 versus previous month
National nonresidential construction spending increased by 0.7% in March, according to an Associated Builders and Contractors analysis of data published today by the U.S. Census Bureau. On a seasonally adjusted annualized basis, nonresidential spending totaled $997.1 billion for the month.

Hotel Facilities | May 2, 2023
U.S. hotel construction up 9% in the first quarter of 2023, led by Marriott and Hilton
In the latest United States Construction Pipeline Trend Report from Lodging Econometrics (LE), analysts report that construction pipeline projects in the U.S. continue to increase, standing at 5,545 projects/658,207 rooms at the close of Q1 2023. Up 9% by both projects and rooms year-over-year (YOY); project totals at Q1 ‘23 are just 338 projects, or 5.7%, behind the all-time high of 5,883 projects recorded in Q2 2008.


