


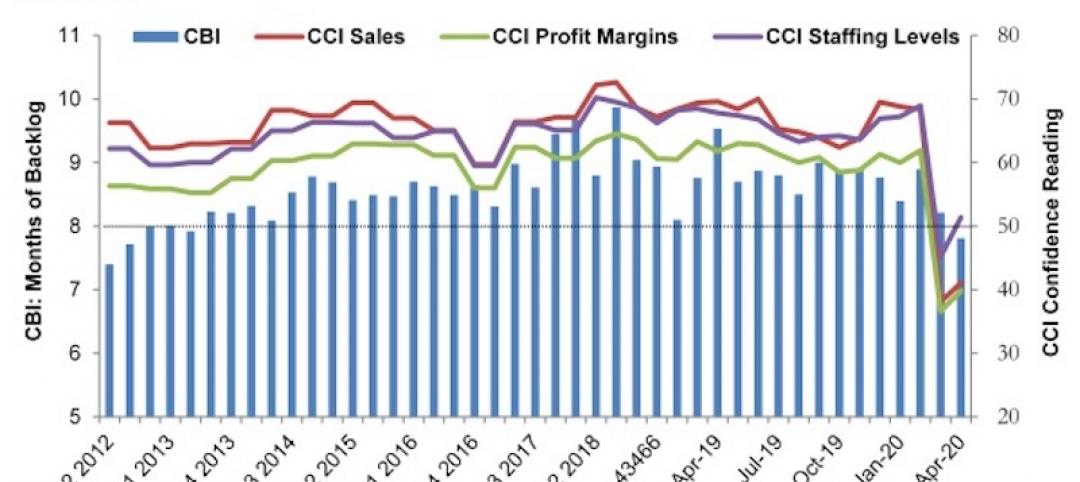
Associated Builders and Contractors (ABC) reports that its Construction Backlog Indicator (CBI) contracted to 8.8 months during the first quarter of 2018, down 9% from the prior quarter. CBI is down 2% on a year-over-year basis.
“The Construction Backlog Indicator hit an all-time high during the fourth quarter of 2017,” said ABC Chief Economist Anirban Basu. “A number of factors pushed backlog lower during the first quarter of 2018, including an extensive winter. Only one region has experienced a decline in backlog on a year-over-year basis: the Middle States, which encompasses the Upper Midwest. There also was a significant uptick in survey participation during the first quarter, which may have helped shape the result. In sum, average backlog remains lofty by historic standards.
“Given improved weather and normal seasonal factors, it is likely that backlog will bounce back during the second quarter. However, the level of improvement may be undermined by a combination of worker shortages and rapidly rising construction materials prices. Despite recent increases in the costs of delivering construction services due to rising human capital and materials costs, there is scant evidence of a decline in demand for construction services,” said Basu.

Highlights by Region
— Backlog in the South fell 8% during the first quarter, but remains 2.9% higher on a year-over-year basis. Large metropolitan areas such as Tampa, Fla., Atlanta, Dallas and Austin, Texas, continue to generate significant construction activity. Expect backlog to remain lengthy as communities impacted by last year’s storms continue to rebuild.
— Backlog in the Northeast fell after expanding for five consecutive quarters. Large cities along the northeast corridor continue to attract commercial investment, including the suburbs of Baltimore. Despite the first quarter decline in backlog, the region’s reading remains elevated by historical standards.
— Backlog in the Middle States is down 12.6% for the quarter (more than a full month) and 14.7% year over year. Weather played a role, but other factors are at work. Tariffs and threats of trade wars impact this region disproportionately given its central role in the nation’s industrial production.
— Backlog in the West surged to its highest level since mid-2014. Rebuilding from prior wildfires likely played a role, but the bigger reason relates to surging technology sectors in San Jose, Calif., San Francisco, Seattle, Portland, Ore., Los Angeles and San Diego.

Highlights by Industry
— Backlog in the commercial/institutional segment fell for the first time since the end of 2016. Despite the 8.8% quarterly decline, backlog in this segment remains 3.2% higher than the same time one year ago. However, this sector is vulnerable to further declines given its significant exposure to rising borrowing costs, higher materials prices and growing concerns regarding product saturation in a number of first-tier American real estate markets.
— Average backlog in the heavy industrial category rebounded during the first quarter, expanding 13.5%. Despite this sizable increase, the segment remains roughly unchanged at historically low levels on a year-over-year basis. Construction spending related to manufacturing has been drifting lower for months. While there have been some highly visible announcements regarding large capital projects in this segment, concerns regarding trade wars are likely to suppress backlog to a meaningful degree.
— Backlog in the infrastructure category drifted back to Earth during the first quarter, declining by more than two months from levels observed during the fourth quarter of 2017. This reading may have been impacted by a sharp increase in survey participation. Weather likely played an even larger role. The expectation is that backlog in this category will expand for the balance of the year as improving state and local government finances spur more investment in education, public safety, highway/street and other publicly financed categories.

Highlights by Company Size
— Large firms—those with annual revenues in excess of $100 million—experienced a sharp decline in backlog. This overlapped neatly with the decline in backlog related to infrastructure. Backlog for these large firms remains higher than any other classification considered in this release.
— Backlog among firms with annual revenues between $50 million and $100 million increased 0.4 months during the first quarter and currently stands at its second highest level since the series began in 2008. This group is heavily impacted by certain construction segments that have experienced little interruption in construction spending momentum.
— Firms with between $30 million and $50 million in annual revenues experienced a sharp decline in first quarter backlog. Enhanced survey participation likely explains part of this result. This group is significantly exposed to the energy sector, which stands to see an uptick in activity given recent trends in oil prices.
— Backlog for firms with annual revenues of less than $30 million increased 0.3 months during the first quarter and remains remarkable steady. This stability is likely the product of a dearth of available subcontractors to do electrical, mechanical, glass installation and other forms of work.
CBI is a leading economic indicator that reflects the amount of construction work under contract, but not yet completed. CBI is measured in months, with a lengthening backlog implying expanding demand for construction services. More CBI charts and graphs are available on abc.org.
Related Stories

Market Data | May 18, 2020
5 must reads for the AEC industry today: May 18, 2020
California's grid can support all-electric buildings and you'll miss your office when it's gone.

Market Data | May 15, 2020
6 must reads for the AEC industry today: May 15, 2020
Nonresidential construction employment sees record loss and Twitter will keep all of its office space.
Market Data | May 15, 2020
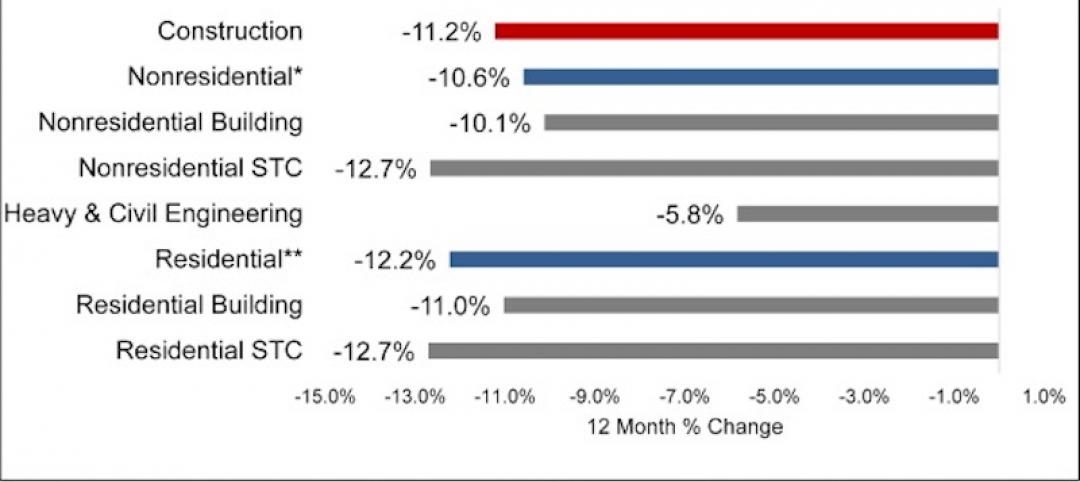
Nonresidential construction employment sees record loss in April
The construction unemployment rate was 16.6% in April, up 11.9 percentage points from the same time last year.
Market Data | May 14, 2020
5 must reads for the AEC industry today: May 14, 2020
The good news about rent might not be so good and some hotel developers consider whether to abandon projects.

Market Data | May 13, 2020
House democrats' coronavirus measure provides some relief for contractors, but lacks other steps needed to help construction
Construction official says new highway funding, employee retention credits and pension relief will help, but lack of safe harbor measure, Eextension of unemployment bonus will undermine recovery.

Market Data | May 13, 2020
5 must reads for the AEC industry today: May 13, 2020
How to design resilient libraries in a post-covid world and vacation real-estate markets are 'toast.'
Market Data | May 12, 2020
ABC’s Construction Backlog Indicator falls in April; Contractor Confidence rebounds from historic lows
Nonresidential construction backlog is down 0.4 months compared to the March 2020 ABC survey and 1.7 months from April 2019.

Market Data | May 12, 2020
6 must reads for the AEC industry today: May 12, 2020
A 13-point plan to reduce coronavirus deaths in nursing homes and Bjarke Ingels discusses building on Mars.

Market Data | May 11, 2020
Interest in eSports is booming amid COVID-19
The industry has proved largely immune to the COVID-19 pandemic due to its prompt transition into online formats and sudden spike in interest from traditional sports organizations.

Market Data | May 11, 2020
6 must reads for the AEC industry today: May 11, 2020
Nashville residential tower will rise 416 feet and the construction industry loses 975,000 jobs.


