


Associated Builders and Contractors reported today that its Construction Backlog Indicator climbed to nine months in August 2019, up 0.5 months or 5.4% from July 2019, when CBI stood at 8.5 months.
“Despite some other leading indicators suggesting weakening in nonresidential construction spending, our most recent backlog readings show that contractors are still experiencing significant demand for construction services” said ABC Chief Economist Anirban Basu. “The primary issue for most contractors is not a lack of demand, but an ongoing and worsening shortage of skilled workers available to meet contractual requirements.
“Though this month’s report was generally positive, softening activity in the nation’s manufacturing sector is becoming more apparent in construction data,” said Basu. “Specifically, backlog in the heavy industrial category slipped to 7.7 months in August, a decline of 12%. A number of key manufacturing indicators have been weakening of late, including capacity utilization and the Institute for Supply Management’s index for manufacturing. It appears that the slowdown in factory activity is now being reflected in construction spending data.
“By contrast, backlog for those involved in heavy highway projects or other forms of infrastructure reached 10.4 months, an increase of nearly 13%,” said Basu. “The implication is that state and local governments are leveraging stronger fiscal positions and lower borrowing costs to move forward with more infrastructure projects. Not only is this a source of strength for the U.S. economy, it is helping to support overall nonresidential construction spending. Growing contractual volume in the infrastructure category helped to push backlog among Middle States contractors up to 8.8 months, a 1.8-month gain. Overall, backlog continues to be lengthiest in the South and West.”


Related Stories
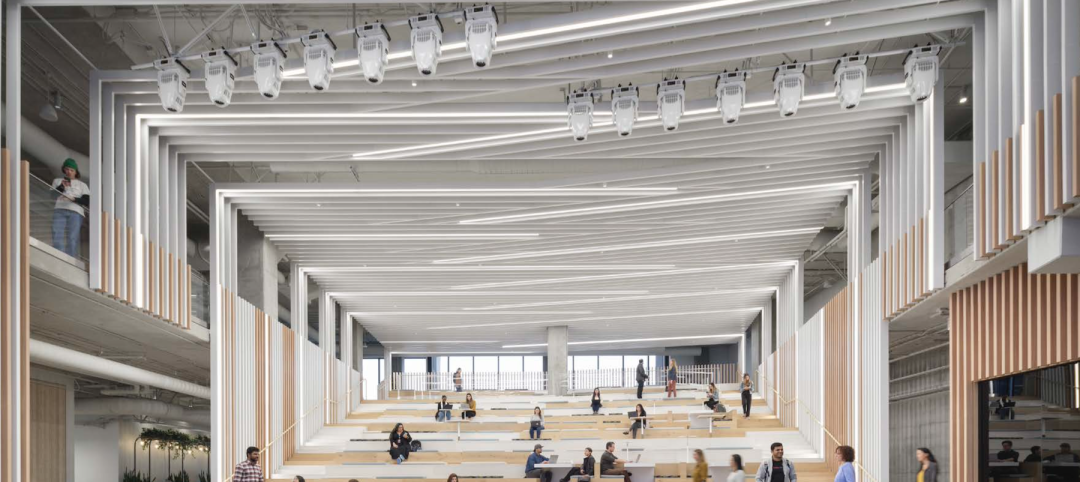
Designers | Dec 25, 2023
Redefining the workplace is a central theme in Gensler’s latest Design Report
The firm identifies eight mega trends that mostly stress human connections.

Contractors | Dec 12, 2023
The average U.S. contractor has 8.5 months worth of construction work in the pipeline, as of November 2023
Associated Builders and Contractors reported today that its Construction Backlog Indicator inched up to 8.5 months in November from 8.4 months in October, according to an ABC member survey conducted Nov. 20 to Dec. 4. The reading is down 0.7 months from November 2022.

Market Data | Nov 27, 2023
Number of employees returning to the office varies significantly by city
While the return-to-the-office trend is felt across the country, the percentage of employees moving back to their offices varies significantly according to geography, according to Eptura’s Q3 Workplace Index.

Market Data | Nov 14, 2023
The average U.S. contractor has 8.4 months worth of construction work in the pipeline, as of September 2023
Associated Builders and Contractors reported that its Construction Backlog Indicator declined to 8.4 months in October from 9.0 months in September, according to an ABC member survey conducted from Oct. 19 to Nov. 2. The reading is down 0.4 months from October 2022. Backlog now stands at its lowest level since the first quarter of 2022.

Multifamily Housing | Nov 9, 2023
Multifamily project completions forecast to slow starting 2026
Yardi Matrix has released its Q4 2023 Multifamily Supply Forecast, emphasizing a short-term spike and plateau of new construction.

Contractors | Nov 1, 2023
Nonresidential construction spending increases for the 16th straight month, in September 2023
National nonresidential construction spending increased 0.3% in September, according to an Associated Builders and Contractors analysis of data published today by the U.S. Census Bureau. On a seasonally adjusted annualized basis, nonresidential spending totaled $1.1 trillion.

Market Data | Oct 23, 2023
New data finds that the majority of renters are cost-burdened
The most recent data derived from the 2022 Census American Community Survey reveals that the proportion of American renters facing housing cost burdens has reached its highest point since 2012, undoing the progress made in the ten years leading up to the pandemic.

Contractors | Oct 19, 2023
Crane Index indicates slowing private-sector construction
Private-sector construction in major North American cities is slowing, according to the latest RLB Crane Index. The number of tower cranes in use declined 10% since the first quarter of 2023. The index, compiled by consulting firm Rider Levett Bucknall (RLB), found that only two of 14 cities—Boston and Toronto—saw increased crane counts.

Market Data | Oct 2, 2023
Nonresidential construction spending rises 0.4% in August 2023, led by manufacturing and public works sectors
National nonresidential construction spending increased 0.4% in August, according to an Associated Builders and Contractors analysis of data published today by the U.S. Census Bureau. On a seasonally adjusted annualized basis, nonresidential spending totaled $1.09 trillion.

Giants 400 | Sep 28, 2023
Top 100 University Building Construction Firms for 2023
Turner Construction, Whiting-Turner Contracting Co., STO Building Group, Suffolk Construction, and Skanska USA top BD+C's ranking of the nation's largest university sector contractors and construction management firms for 2023, as reported in Building Design+Construction's 2023 Giants 400 Report. Note: This ranking includes revenue for all university/college-related buildings except student residence halls, sports/recreation facilities, laboratories, S+T-related buildings, parking facilities, and performing arts centers (revenue for those buildings are reported in their respective Giants 400 ranking).


