


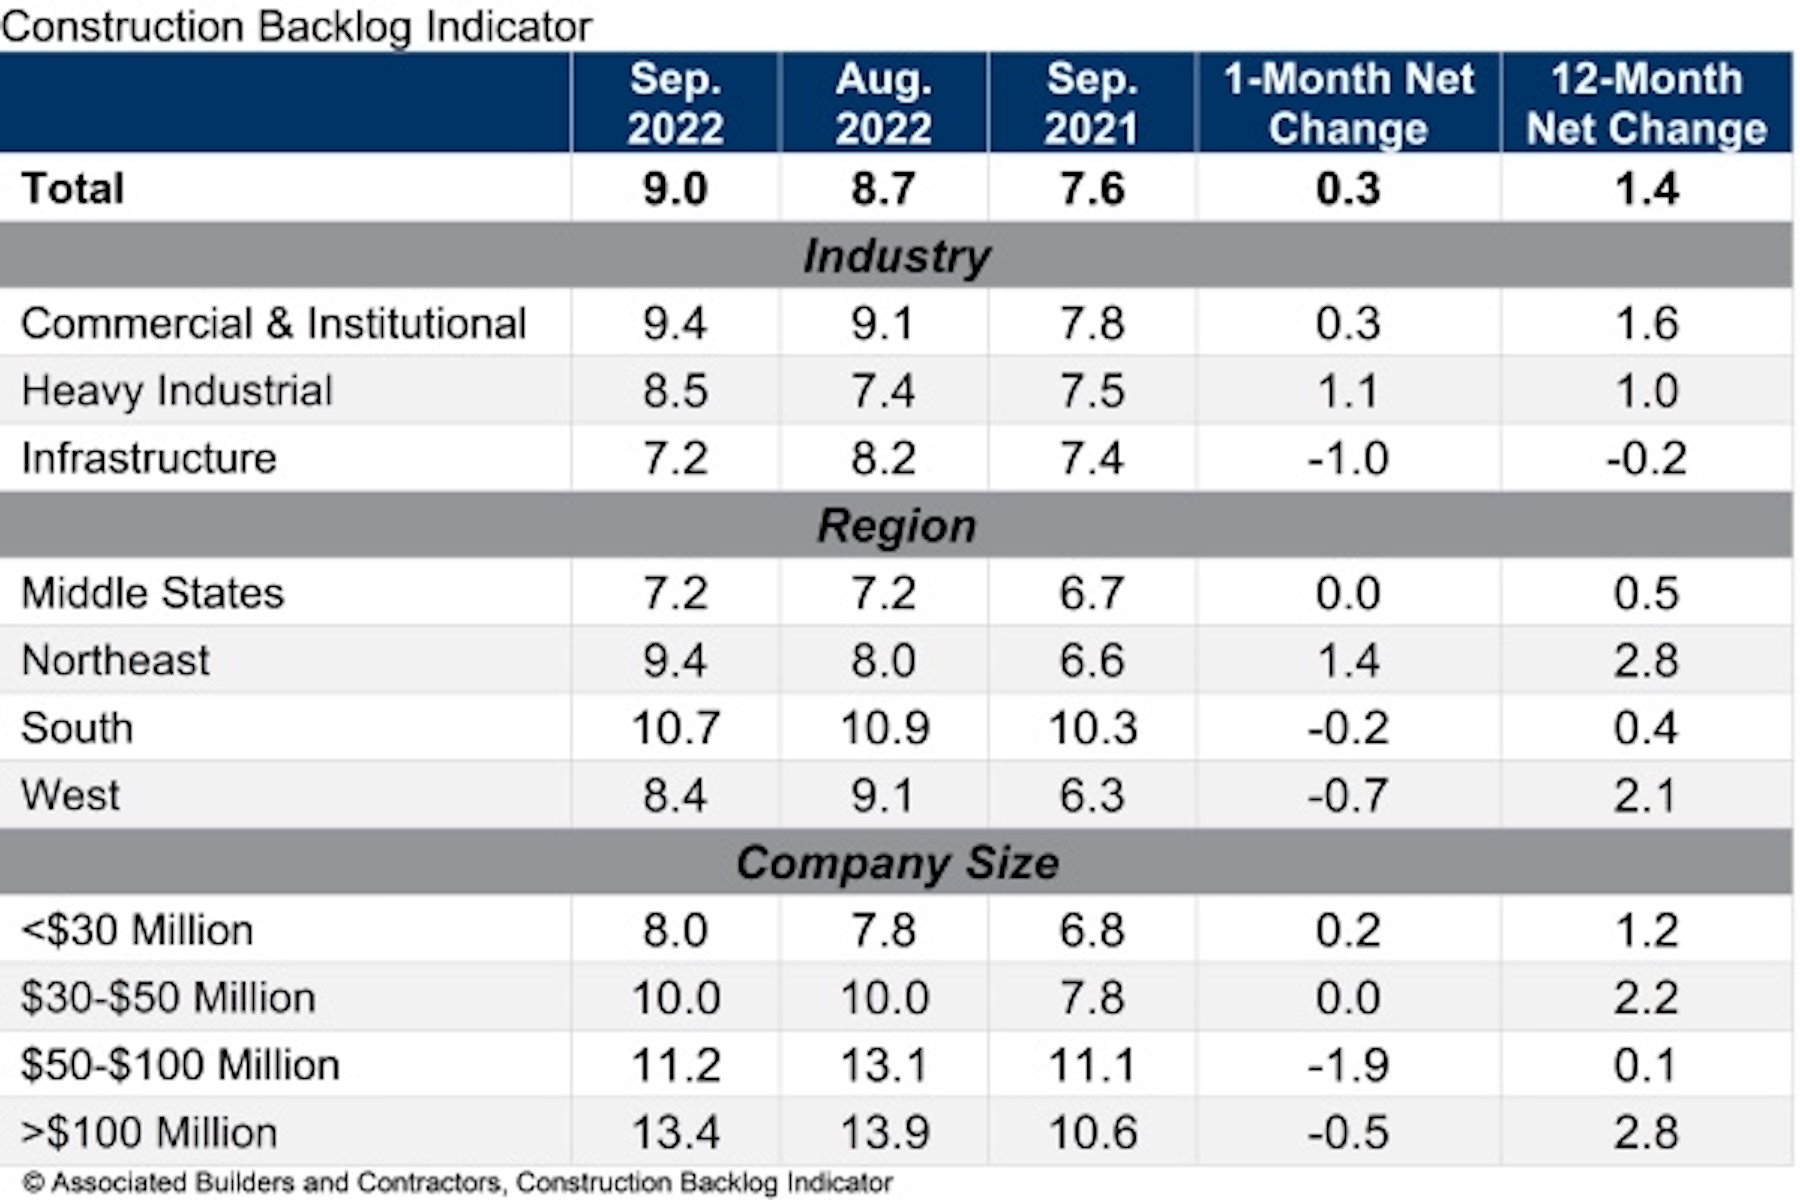
Associated Builders and Contractors reports today that its Construction Backlog Indicator increased to 9.0 months in September, according to an ABC member survey conducted Sept. 20 to Oct. 5. The reading is 1.4 months higher than in September 2021.
View ABC’s Construction Backlog Indicator and Construction Confidence Index tables for September 2022.
Backlog reached its highest level since May 2022 and is once again above the level observed at the start of the pandemic (8.9 months in February 2020). Backlog in heavy industrial increased sizably in September, spurred by a 21.5% year-over-year increase in manufacturing-related construction spending.
ABC’s Construction Confidence Index readings for profit margins and staffing levels increased in September, while the reading for sales moved slightly lower. All three readings remain above the threshold of 50, indicating expectations of growth over the next six months.
“The construction confidence and backlog metrics appear strong despite the U.S. economy facing headwinds like inflation, financial market volatility and rapidly rising borrowing costs,” said ABC Chief Economist Anirban Basu. “Contractors remain decidedly upbeat, with backlog expanding and expectations for rising sales, employment and profit margins over the next six months.
“One would think the recent surge in interest rates would be enough to dampen contractor confidence,” said Basu. “Instead, project owners continue to move forward with a significant number of projects. Faced with high demand for their services, contractors continue to show pricing power, helping to offset rising compensation and other construction delivery costs.”
Note: The reference months for the Construction Backlog Indicator and Construction Confidence Index data series were revised on May 12, 2020, to better reflect the survey period. CBI quantifies the previous month’s work under contract based on the latest financials available, while CCI measures contractors’ outlook for the next six months.
Related Stories

Market Data | Mar 15, 2019
2019 starts off with expansion in nonresidential spending
At a seasonally adjusted annualized rate, nonresidential spending totaled $762.5 billion for the month.

Market Data | Mar 14, 2019
Construction input prices rise for first time since October
Of the 11 construction subcategories, seven experienced price declines for the month.

Market Data | Mar 6, 2019
Global hotel construction pipeline hits record high at 2018 year-end
There are a record-high 6,352 hotel projects and 1.17 million rooms currently under construction worldwide.

Market Data | Feb 28, 2019
U.S. economic growth softens in final quarter of 2018
Year-over-year GDP growth was 3.1%, while average growth for 2018 was 2.9%.

Market Data | Feb 20, 2019
Strong start to 2019 for architecture billings
“The government shutdown affected architecture firms, but doesn’t appear to have created a slowdown in the profession,” said AIA Chief Economist Kermit Baker, Hon. AIA, PhD, in the latest ABI report.

Market Data | Feb 19, 2019
ABC Construction Backlog Indicator steady in Q4 2018
CBI reached a record high of 9.9 months in the second quarter of 2018 and averaged about 9.1 months throughout all four quarters of last year.

Market Data | Feb 14, 2019
U.S. Green Building Council announces top 10 countries and regions for LEED green building
The list ranks countries and regions in terms of cumulative LEED-certified gross square meters as of December 31, 2018.

Market Data | Feb 13, 2019
Increasingly tech-enabled construction industry powers forward despite volatility
Construction industry momentum to carry through first half of 2019.

Market Data | Feb 4, 2019
U.S. Green Building Council announces annual Top 10 States for LEED Green Building in 2018
Illinois takes the top spot as USGBC defines the next generation of green building with LEED v4.1.

Market Data | Feb 4, 2019
Nonresidential construction spending dips in November
Total nonresidential spending stood at $751.5 billion on a seasonally adjusted annualized rate.


