


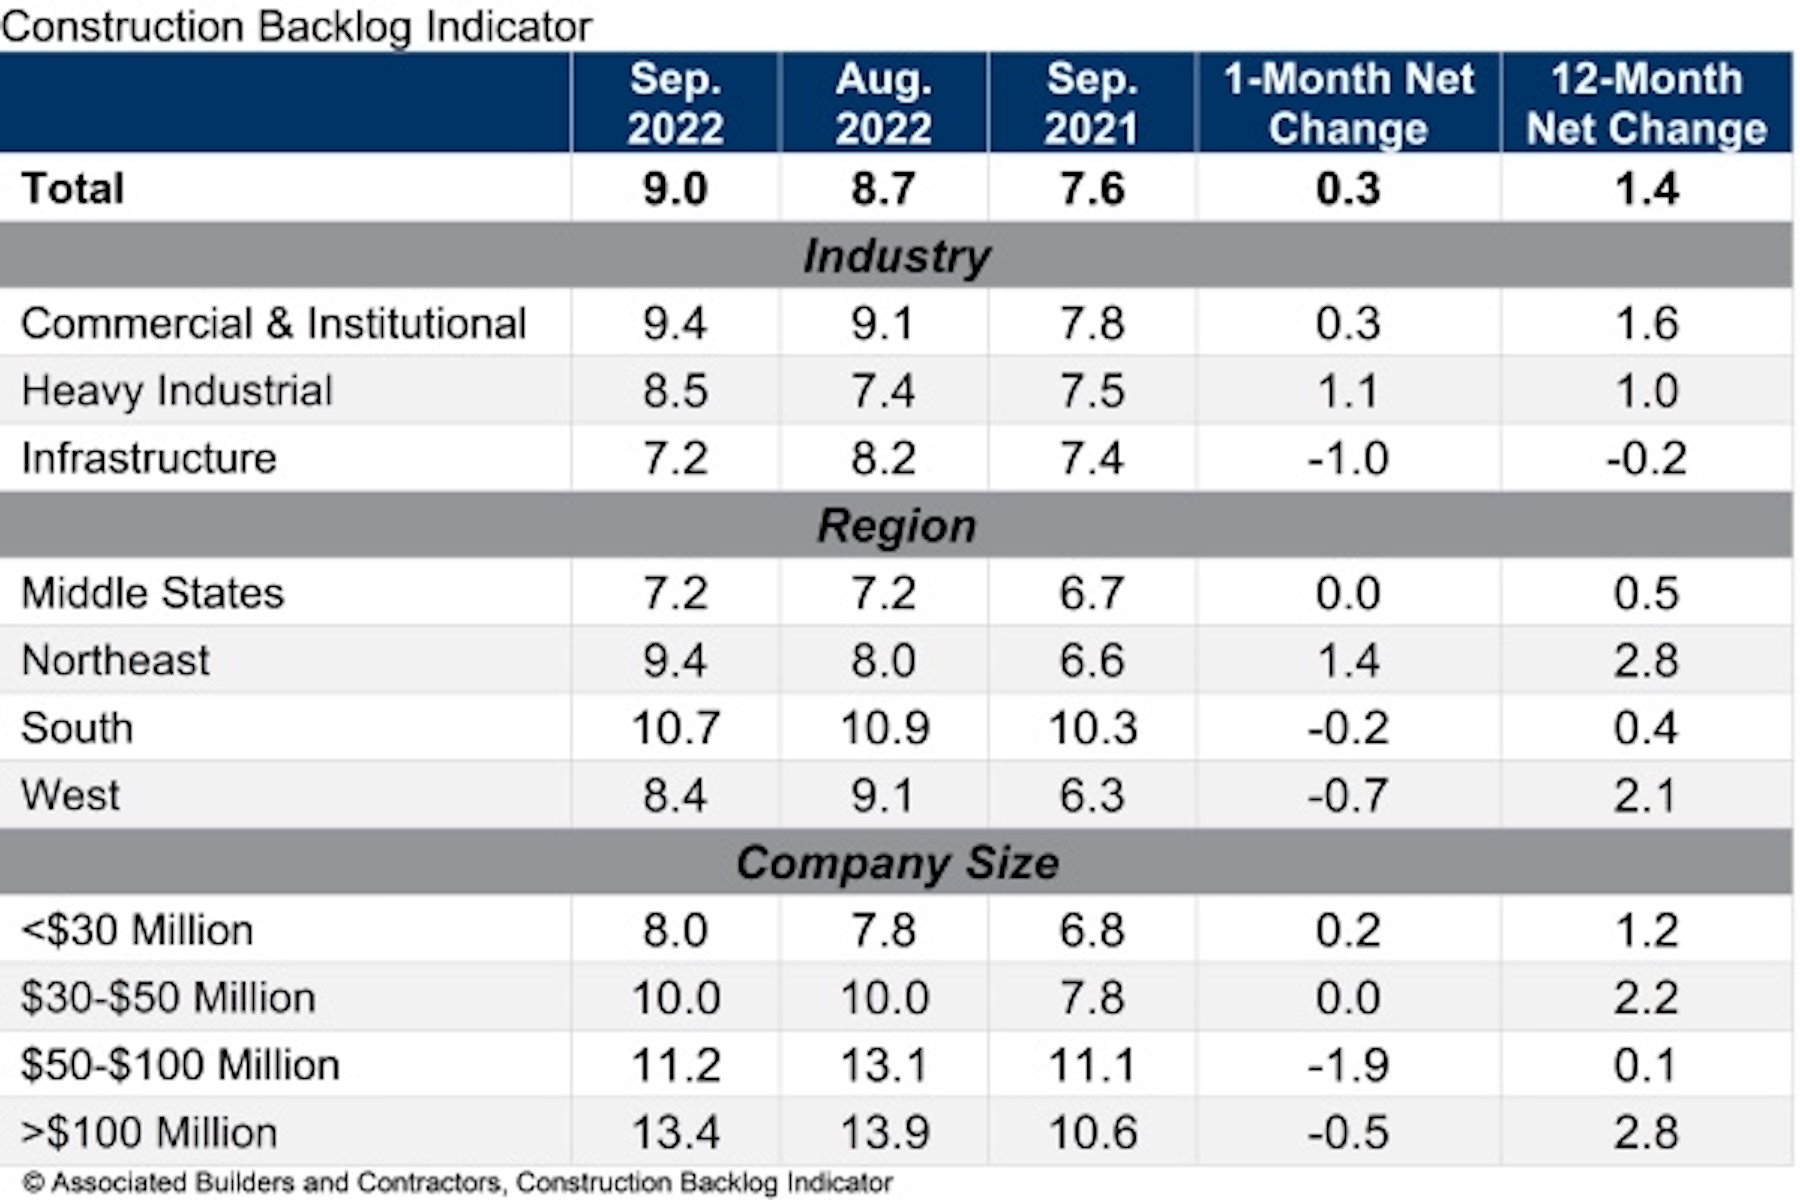
Associated Builders and Contractors reports today that its Construction Backlog Indicator increased to 9.0 months in September, according to an ABC member survey conducted Sept. 20 to Oct. 5. The reading is 1.4 months higher than in September 2021.
View ABC’s Construction Backlog Indicator and Construction Confidence Index tables for September 2022.
Backlog reached its highest level since May 2022 and is once again above the level observed at the start of the pandemic (8.9 months in February 2020). Backlog in heavy industrial increased sizably in September, spurred by a 21.5% year-over-year increase in manufacturing-related construction spending.
ABC’s Construction Confidence Index readings for profit margins and staffing levels increased in September, while the reading for sales moved slightly lower. All three readings remain above the threshold of 50, indicating expectations of growth over the next six months.
“The construction confidence and backlog metrics appear strong despite the U.S. economy facing headwinds like inflation, financial market volatility and rapidly rising borrowing costs,” said ABC Chief Economist Anirban Basu. “Contractors remain decidedly upbeat, with backlog expanding and expectations for rising sales, employment and profit margins over the next six months.
“One would think the recent surge in interest rates would be enough to dampen contractor confidence,” said Basu. “Instead, project owners continue to move forward with a significant number of projects. Faced with high demand for their services, contractors continue to show pricing power, helping to offset rising compensation and other construction delivery costs.”
Note: The reference months for the Construction Backlog Indicator and Construction Confidence Index data series were revised on May 12, 2020, to better reflect the survey period. CBI quantifies the previous month’s work under contract based on the latest financials available, while CCI measures contractors’ outlook for the next six months.
Related Stories

Market Data | Aug 13, 2018
First Half 2018 commercial and multifamily construction starts show mixed performance across top metropolitan areas
Gains reported in five of the top ten markets.

Market Data | Aug 10, 2018
Construction material prices inch down in July
Nonresidential construction input prices increased fell 0.3% in July but are up 9.6% year over year.

Market Data | Aug 9, 2018
Projections reveal nonresidential construction spending to grow
AIA releases latest Consensus Construction Forecast.
Market Data | Aug 7, 2018
New supply's impact illustrated in Yardi Matrix national self storage report for July
The metro with the most units under construction and planned as a percent of existing inventory in mid-July was Nashville, Tenn.

Market Data | Aug 3, 2018
U.S. multifamily rents reach new heights in July
Favorable economic conditions produce a sunny summer for the apartment sector.

Market Data | Aug 2, 2018
Nonresidential construction spending dips in June
“The hope is that June’s construction spending setback is merely a statistical aberration,” said ABC Chief Economist Anirban Basu.

Market Data | Aug 1, 2018
U.S. hotel construction pipeline continues moderate growth year-over-year
The hotel construction pipeline has been growing moderately and incrementally each quarter.

Market Data | Jul 30, 2018
Nonresidential fixed investment surges in second quarter
Nonresidential fixed investment represented an especially important element of second quarter strength in the advance estimate.

Market Data | Jul 11, 2018
Construction material prices increase steadily in June
June represents the latest month associated with rapidly rising construction input prices.

Market Data | Jun 26, 2018
Yardi Matrix examines potential regional multifamily supply overload
Outsize development activity in some major metros could increase vacancy rates and stagnate rent growth.


