

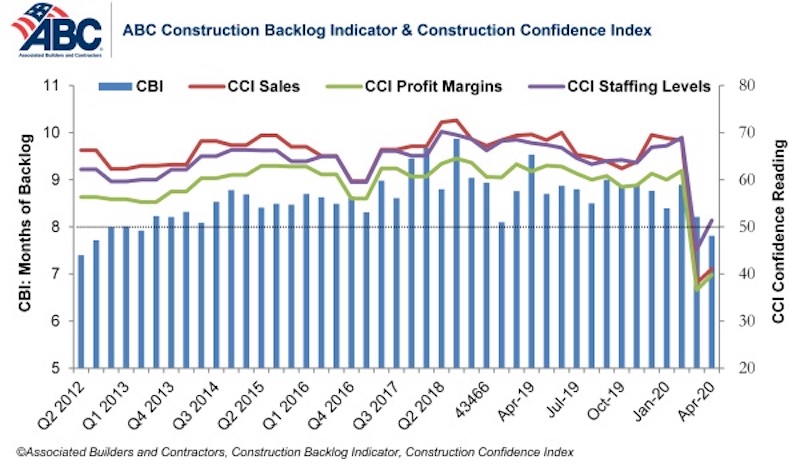
Associated Builders and Contractors reported today that its Construction Backlog Indicator fell to 7.8 months in April, the series’ lowest reading since the third quarter of 2012. Based on an ABC member survey conducted April 20-May 4, the results indicate that confidence among U.S. construction industry leaders inched higher last month compared to the historically low levels observed in the March survey.
Nonresidential construction backlog is down 0.4 months compared to the March 2020 ABC survey and 1.7 months from April 2019. Backlog has declined year-over-year in every industry classification, region and company size. Backlog in the infrastructure category has been stable, however, and reached its highest level since December 2019.
ABC’s Construction Confidence Index readings for sales, profit margins and staffing levels expectations all increased from the historically low levels reported in the March 2020 survey, although sales and profit margin expectations remain below the threshold of 50, indicating ongoing expectations of contraction. The staffing level index rose to 51.4 in April, however, indicating positive hiring expectations over the next six months.

More than 55% of contractors expect their sales to decline over the next six months compared to just 34% who expect them to increase. Only 27% of contractors expect to increase their profit margins over the next two quarters. More than half expect to experience diminished margins.
- The CCI for sales expectations increased from 38.1 to 41.1 in April.
- The CCI for profit margin expectations increased from 36.6 to 39.8.
- The CCI for staffing levels increased from 45.2 to 51.4.

“Backlog has not been quite the protective shield that it normally is during the early stages of an economic downturn,” said ABC Chief Economist Anirban Basu. “These survey data indicate that only 30% of nonresidential contractors have enjoyed uninterrupted work flows recently. Roughly two in five contractors indicate that their work has been interrupted by government mandate. Other sources of interruption to construction projects include labor force issues as well as a lack of personal protective equipment and/or key construction inputs.
“Given the large quantity of businesses that will likely not survive the public health and economic crisis, demand for construction services could be suppressed for quite some time,” said Basu. “Vacant storefronts, empty office suites and shattered state and local government finances do not serve as a solid foundation for robust demand for construction services. For construction activity to rebound briskly, the federal government is going to have to step forward and provide substantial assistance to state and local governments, including to finance infrastructure improvements.”


Note: The reference months for the Construction Backlog Indicator and Construction Confidence Index data series were revised on May 12 to better reflect the survey period. CBI quantifies the previous month’s work under contract based on the latest financials available, while CCI measures contractors’ outlook for the next six months.
Related Stories

Market Data | May 23, 2018
Architecture firm billings strengthen in April
Firms report solid growth for seven straight months.

Market Data | May 22, 2018
Vacancies stable, rents rising, and pipeline receding, according to Transwestern’s 1Q US Office Market report
The Big Apple still leads the new construction charge.

Market Data | May 18, 2018
Construction employment rises in 38 states and D.C. from April 2017 to April 2018
California & West Virginia have biggest annual job gains, North Dakota has largest decline; California & Louisiana have largest monthly pickup, Indiana & North Dakota lead monthly drops.

High-rise Construction | May 18, 2018
The 100 tallest buildings ever conventionally demolished
The list comes from a recent CTBUH study.

Resiliency | May 17, 2018
Architects brief lawmakers and policy-makers on disaster recovery as hurricane season approaches
Urge senate passage of disaster recovery reform act; Relationship-building with local communities.

Market Data | May 17, 2018
These 25 cities have the highest urban infill development potential
The results stem from a COMMERCIALCafé study.

Market Data | May 10, 2018
Construction costs surge in April as new tariffs and other trade measures lead to significant increases in materials prices
Association officials warn that the new tariffs and resulting price spikes have the potential to undermine benefits of tax and regulatory reform, urge administration to reconsider.

Market Data | May 7, 2018
Construction employers add 17,000 jobs in April and 257,000 for the year
Unemployment rate for construction increases slightly compared to year earlier as higher pay levels appears to be attracting people with recent construction experience back into the workforce.

Market Data | May 2, 2018
Construction employment increases in 245 metro areas between March 2017 & 2018, as trade fights & infrastructure funding shortfalls loom
Houston-The Woodlands-Sugar Land, Texas and Weirton-Steubenville, W.Va.-Ohio experience largest year-over-year gains; Baton Rouge, La. and Auburn-Opelika, Ala. have biggest annual declines.

Market Data | May 2, 2018
Nonresidential Construction down in March, private sector falters, public sector unchanged
February’s spending estimate was revised roughly $10 billion higher.


