

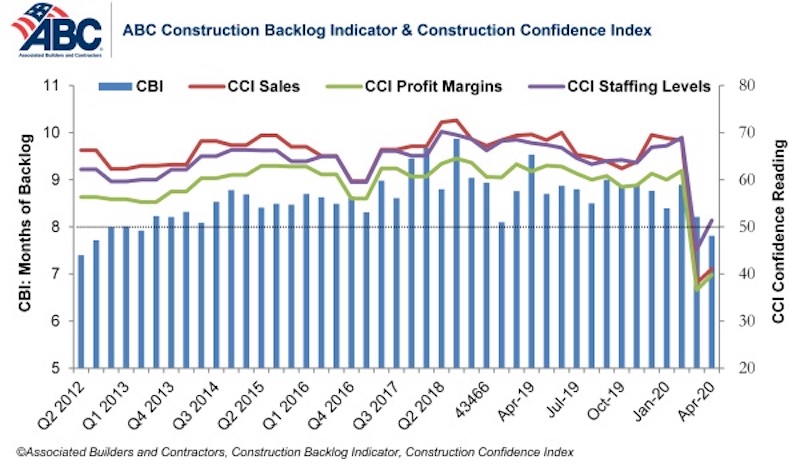
Associated Builders and Contractors reported today that its Construction Backlog Indicator fell to 7.8 months in April, the series’ lowest reading since the third quarter of 2012. Based on an ABC member survey conducted April 20-May 4, the results indicate that confidence among U.S. construction industry leaders inched higher last month compared to the historically low levels observed in the March survey.
Nonresidential construction backlog is down 0.4 months compared to the March 2020 ABC survey and 1.7 months from April 2019. Backlog has declined year-over-year in every industry classification, region and company size. Backlog in the infrastructure category has been stable, however, and reached its highest level since December 2019.
ABC’s Construction Confidence Index readings for sales, profit margins and staffing levels expectations all increased from the historically low levels reported in the March 2020 survey, although sales and profit margin expectations remain below the threshold of 50, indicating ongoing expectations of contraction. The staffing level index rose to 51.4 in April, however, indicating positive hiring expectations over the next six months.

More than 55% of contractors expect their sales to decline over the next six months compared to just 34% who expect them to increase. Only 27% of contractors expect to increase their profit margins over the next two quarters. More than half expect to experience diminished margins.
- The CCI for sales expectations increased from 38.1 to 41.1 in April.
- The CCI for profit margin expectations increased from 36.6 to 39.8.
- The CCI for staffing levels increased from 45.2 to 51.4.

“Backlog has not been quite the protective shield that it normally is during the early stages of an economic downturn,” said ABC Chief Economist Anirban Basu. “These survey data indicate that only 30% of nonresidential contractors have enjoyed uninterrupted work flows recently. Roughly two in five contractors indicate that their work has been interrupted by government mandate. Other sources of interruption to construction projects include labor force issues as well as a lack of personal protective equipment and/or key construction inputs.
“Given the large quantity of businesses that will likely not survive the public health and economic crisis, demand for construction services could be suppressed for quite some time,” said Basu. “Vacant storefronts, empty office suites and shattered state and local government finances do not serve as a solid foundation for robust demand for construction services. For construction activity to rebound briskly, the federal government is going to have to step forward and provide substantial assistance to state and local governments, including to finance infrastructure improvements.”


Note: The reference months for the Construction Backlog Indicator and Construction Confidence Index data series were revised on May 12 to better reflect the survey period. CBI quantifies the previous month’s work under contract based on the latest financials available, while CCI measures contractors’ outlook for the next six months.
Related Stories

Market Data | Jul 16, 2019
ABC’s Construction Backlog Indicator increases modestly in May
The Construction Backlog Indicator expanded to 8.9 months in May 2019.

K-12 Schools | Jul 15, 2019
Summer assignments: 2019 K-12 school construction costs
Using RSMeans data from Gordian, here are the most recent costs per square foot for K-12 school buildings in 10 cities across the U.S.

Market Data | Jul 12, 2019
Construction input prices plummet in June
This is the first time in nearly three years that input prices have fallen on a year-over-year basis.

Market Data | Jul 1, 2019
Nonresidential construction spending slips modestly in May
Among the 16 nonresidential construction spending categories tracked by the Census Bureau, five experienced increases in monthly spending.

Market Data | Jul 1, 2019
Almost 60% of the U.S. construction project pipeline value is concentrated in 10 major states
With a total of 1,302 projects worth $524.6 billion, California has both the largest number and value of projects in the U.S. construction project pipeline.

Market Data | Jun 21, 2019
Architecture billings remain flat
AIA’s Architecture Billings Index (ABI) score for May showed a small increase in design services at 50.2.

Market Data | Jun 19, 2019
Number of U.S. architects continues to rise
New data from NCARB reveals that the number of architects continues to increase.

Market Data | Jun 12, 2019
Construction input prices see slight increase in May
Among the 11 subcategories, six saw prices fall last month, with the largest decreases in natural gas.

Market Data | Jun 3, 2019
Nonresidential construction spending up 6.4% year over year in April
Among the 16 sectors tracked by the U.S. Census Bureau, nine experienced an increase in monthly spending, led by water supply and highway and street.

Market Data | Jun 3, 2019
4.1% annual growth in office asking rents above five-year compound annual growth rate
Market has experienced no change in office vacancy rates in three quarters.


