


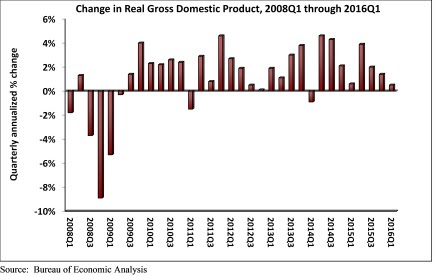
Real gross domestic product (GDP) expanded only 0.5% on a seasonally adjusted annual rate during 2016's first quarter according to an analysis of Bureau of Economic Analysis data released today by Associated Builders and Contractors (ABC). This disappointing figure follows a 1.4% annualized rate of economic output expansion during the fourth quarter of 2015.
Nonresidential fixed investment struggled with a 5.9% decline during the year's first three months after falling 2.1% during 2015's final quarter. Nonresidential fixed investment in structures fared particularly poorly, declining 10.7% during the first quarter on an annualized basis while nonresidential investment in equipment fell 8.6%.
"Aside from consumer spending growth, state and local government spending growth and residential building, very little expanded in America during the first three months of 2016," said ABC Chief Economist Anirban Basu. "It is quite conceivable that the current U.S. economic expansion will end before the economy registers a 3% or better rate of growth for a single calendar year. The last time the U.S. economy expanded more than 3% was in 2005, when the economy expanded 3.4%."
"Corporate profitability has been slipping in recent quarters and the mergers and acquisition marketplace has heated up, an unfavorable sign for nonresidential contractors," said Basu. "Many corporate CEOs continue to use available cash to purchase competitors either to gain access to product pipelines, thereby diminishing required product development expenses, or to generate cost savings by eliminating duplicative functions. The result is a lack of business investment generally and a slowing pace of private nonresidential construction spending growth. If it not for an enormous amount of foreign money coming to our shores, private nonresidential construction growth would have been even softer in early 2016. While falling energy-related investment and seasonal factors represent important parts of the story, there are indications of a broader malaise."
The following segments highlight the first quarter GDP release:
- Personal consumption expenditures rose 1.9% on an annualized basis during the first quarter of 2016 after growing 2.4% during the fourth quarter of 2015.
- Spending on goods inched 0.1% higher during the first quarter after expanding by 1.6% during the fourth quarter.
- Real final sales of domestically produced output increased 0.9% in the first quarter after rising 1.6% in the fourth.
- Federal government spending fell by 1.6% in the year's first quarter after expanding 2.3% in the fourth quarter of 2015.
- Nondefense spending increased by 1.5% in both the first quarter of 2016 and the fourth quarter of 2015.
- National defense spending fell by 3.6% in the fourth quarter after registering a 2.8% increase in the previous quarter.
- State and local government spending increased by 2.9% in the first quarter after falling 1.2% during the prior quarter.
Related Stories

Market Data | Feb 1, 2018
Nonresidential construction spending expanded 0.8% in December, brighter days ahead
“The tax cut will further bolster liquidity and confidence, which will ultimately translate into more construction starts and spending,” said ABC Chief Economist Anirban Basu.

Green | Jan 31, 2018
U.S. Green Building Council releases annual top 10 states for LEED green building per capita
Massachusetts tops the list for the second year; New York, Hawaii and Illinois showcase leadership in geographically diverse locations.

Industry Research | Jan 30, 2018
AIA’s Kermit Baker: Five signs of an impending upturn in construction spending
Tax reform implications and rebuilding from natural disasters are among the reasons AIA’s Chief Economist is optimistic for 2018 and 2019.

Market Data | Jan 30, 2018
AIA Consensus Forecast: 4.0% growth for nonresidential construction spending in 2018
The commercial office and retail sectors will lead the way in 2018, with a strong bounce back for education and healthcare.

Market Data | Jan 29, 2018
Year-end data show economy expanded in 2017; Fixed investment surged in fourth quarter
The economy expanded at an annual rate of 2.6% during the fourth quarter of 2017.

Market Data | Jan 25, 2018
Renters are the majority in 42 U.S. cities
Over the past 10 years, the number of renters has increased by 23 million.

Market Data | Jan 24, 2018
HomeUnion names the most and least affordable rental housing markets
Chicago tops the list as the most affordable U.S. metro, while Oakland, Calif., is the most expensive rental market.

Market Data | Jan 12, 2018
Construction input prices inch down in December, Up YOY despite low inflation
Energy prices have been more volatile lately.

Market Data | Jan 4, 2018
Nonresidential construction spending ticks higher in November, down year-over-year
Despite the month-over-month expansion, nonresidential spending fell 1.3 percent from November 2016.

Contractors | Jan 4, 2018
Construction spending in a ‘mature’ period of incremental growth
Labor shortages are spiking wages. Materials costs are rising, too.


