


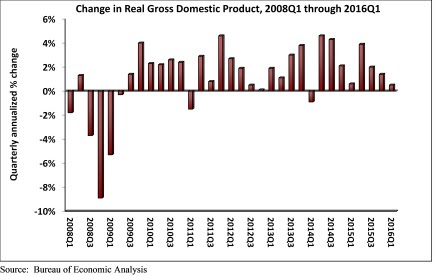
Real gross domestic product (GDP) expanded only 0.5% on a seasonally adjusted annual rate during 2016's first quarter according to an analysis of Bureau of Economic Analysis data released today by Associated Builders and Contractors (ABC). This disappointing figure follows a 1.4% annualized rate of economic output expansion during the fourth quarter of 2015.
Nonresidential fixed investment struggled with a 5.9% decline during the year's first three months after falling 2.1% during 2015's final quarter. Nonresidential fixed investment in structures fared particularly poorly, declining 10.7% during the first quarter on an annualized basis while nonresidential investment in equipment fell 8.6%.
"Aside from consumer spending growth, state and local government spending growth and residential building, very little expanded in America during the first three months of 2016," said ABC Chief Economist Anirban Basu. "It is quite conceivable that the current U.S. economic expansion will end before the economy registers a 3% or better rate of growth for a single calendar year. The last time the U.S. economy expanded more than 3% was in 2005, when the economy expanded 3.4%."
"Corporate profitability has been slipping in recent quarters and the mergers and acquisition marketplace has heated up, an unfavorable sign for nonresidential contractors," said Basu. "Many corporate CEOs continue to use available cash to purchase competitors either to gain access to product pipelines, thereby diminishing required product development expenses, or to generate cost savings by eliminating duplicative functions. The result is a lack of business investment generally and a slowing pace of private nonresidential construction spending growth. If it not for an enormous amount of foreign money coming to our shores, private nonresidential construction growth would have been even softer in early 2016. While falling energy-related investment and seasonal factors represent important parts of the story, there are indications of a broader malaise."
The following segments highlight the first quarter GDP release:
- Personal consumption expenditures rose 1.9% on an annualized basis during the first quarter of 2016 after growing 2.4% during the fourth quarter of 2015.
- Spending on goods inched 0.1% higher during the first quarter after expanding by 1.6% during the fourth quarter.
- Real final sales of domestically produced output increased 0.9% in the first quarter after rising 1.6% in the fourth.
- Federal government spending fell by 1.6% in the year's first quarter after expanding 2.3% in the fourth quarter of 2015.
- Nondefense spending increased by 1.5% in both the first quarter of 2016 and the fourth quarter of 2015.
- National defense spending fell by 3.6% in the fourth quarter after registering a 2.8% increase in the previous quarter.
- State and local government spending increased by 2.9% in the first quarter after falling 1.2% during the prior quarter.
Related Stories
Designers | Dec 25, 2023
Redefining the workplace is a central theme in Gensler’s latest Design Report
The firm identifies eight mega trends that mostly stress human connections.

Contractors | Dec 12, 2023
The average U.S. contractor has 8.5 months worth of construction work in the pipeline, as of November 2023
Associated Builders and Contractors reported today that its Construction Backlog Indicator inched up to 8.5 months in November from 8.4 months in October, according to an ABC member survey conducted Nov. 20 to Dec. 4. The reading is down 0.7 months from November 2022.

Market Data | Nov 27, 2023
Number of employees returning to the office varies significantly by city
While the return-to-the-office trend is felt across the country, the percentage of employees moving back to their offices varies significantly according to geography, according to Eptura’s Q3 Workplace Index.

Market Data | Nov 14, 2023
The average U.S. contractor has 8.4 months worth of construction work in the pipeline, as of September 2023
Associated Builders and Contractors reported that its Construction Backlog Indicator declined to 8.4 months in October from 9.0 months in September, according to an ABC member survey conducted from Oct. 19 to Nov. 2. The reading is down 0.4 months from October 2022. Backlog now stands at its lowest level since the first quarter of 2022.

Multifamily Housing | Nov 9, 2023
Multifamily project completions forecast to slow starting 2026
Yardi Matrix has released its Q4 2023 Multifamily Supply Forecast, emphasizing a short-term spike and plateau of new construction.

Contractors | Nov 1, 2023
Nonresidential construction spending increases for the 16th straight month, in September 2023
National nonresidential construction spending increased 0.3% in September, according to an Associated Builders and Contractors analysis of data published today by the U.S. Census Bureau. On a seasonally adjusted annualized basis, nonresidential spending totaled $1.1 trillion.

Market Data | Oct 23, 2023
New data finds that the majority of renters are cost-burdened
The most recent data derived from the 2022 Census American Community Survey reveals that the proportion of American renters facing housing cost burdens has reached its highest point since 2012, undoing the progress made in the ten years leading up to the pandemic.

Contractors | Oct 19, 2023
Crane Index indicates slowing private-sector construction
Private-sector construction in major North American cities is slowing, according to the latest RLB Crane Index. The number of tower cranes in use declined 10% since the first quarter of 2023. The index, compiled by consulting firm Rider Levett Bucknall (RLB), found that only two of 14 cities—Boston and Toronto—saw increased crane counts.

Market Data | Oct 2, 2023
Nonresidential construction spending rises 0.4% in August 2023, led by manufacturing and public works sectors
National nonresidential construction spending increased 0.4% in August, according to an Associated Builders and Contractors analysis of data published today by the U.S. Census Bureau. On a seasonally adjusted annualized basis, nonresidential spending totaled $1.09 trillion.

Giants 400 | Sep 28, 2023
Top 100 University Building Construction Firms for 2023
Turner Construction, Whiting-Turner Contracting Co., STO Building Group, Suffolk Construction, and Skanska USA top BD+C's ranking of the nation's largest university sector contractors and construction management firms for 2023, as reported in Building Design+Construction's 2023 Giants 400 Report. Note: This ranking includes revenue for all university/college-related buildings except student residence halls, sports/recreation facilities, laboratories, S+T-related buildings, parking facilities, and performing arts centers (revenue for those buildings are reported in their respective Giants 400 ranking).


