


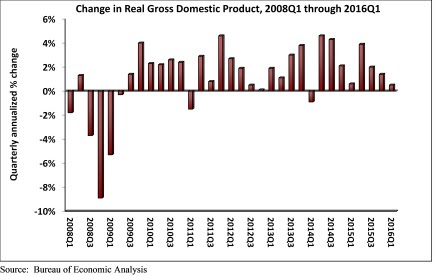
Real gross domestic product (GDP) expanded only 0.5% on a seasonally adjusted annual rate during 2016's first quarter according to an analysis of Bureau of Economic Analysis data released today by Associated Builders and Contractors (ABC). This disappointing figure follows a 1.4% annualized rate of economic output expansion during the fourth quarter of 2015.
Nonresidential fixed investment struggled with a 5.9% decline during the year's first three months after falling 2.1% during 2015's final quarter. Nonresidential fixed investment in structures fared particularly poorly, declining 10.7% during the first quarter on an annualized basis while nonresidential investment in equipment fell 8.6%.
"Aside from consumer spending growth, state and local government spending growth and residential building, very little expanded in America during the first three months of 2016," said ABC Chief Economist Anirban Basu. "It is quite conceivable that the current U.S. economic expansion will end before the economy registers a 3% or better rate of growth for a single calendar year. The last time the U.S. economy expanded more than 3% was in 2005, when the economy expanded 3.4%."
"Corporate profitability has been slipping in recent quarters and the mergers and acquisition marketplace has heated up, an unfavorable sign for nonresidential contractors," said Basu. "Many corporate CEOs continue to use available cash to purchase competitors either to gain access to product pipelines, thereby diminishing required product development expenses, or to generate cost savings by eliminating duplicative functions. The result is a lack of business investment generally and a slowing pace of private nonresidential construction spending growth. If it not for an enormous amount of foreign money coming to our shores, private nonresidential construction growth would have been even softer in early 2016. While falling energy-related investment and seasonal factors represent important parts of the story, there are indications of a broader malaise."
The following segments highlight the first quarter GDP release:
- Personal consumption expenditures rose 1.9% on an annualized basis during the first quarter of 2016 after growing 2.4% during the fourth quarter of 2015.
- Spending on goods inched 0.1% higher during the first quarter after expanding by 1.6% during the fourth quarter.
- Real final sales of domestically produced output increased 0.9% in the first quarter after rising 1.6% in the fourth.
- Federal government spending fell by 1.6% in the year's first quarter after expanding 2.3% in the fourth quarter of 2015.
- Nondefense spending increased by 1.5% in both the first quarter of 2016 and the fourth quarter of 2015.
- National defense spending fell by 3.6% in the fourth quarter after registering a 2.8% increase in the previous quarter.
- State and local government spending increased by 2.9% in the first quarter after falling 1.2% during the prior quarter.
Related Stories

Market Data | Aug 2, 2021
Nonresidential construction spending falls again in June
The fall was driven by a big drop in funding for highway and street construction and other public work.

Market Data | Jul 29, 2021
Outlook for construction spending improves with the upturn in the economy
The strongest design sector performers for the remainder of this year are expected to be health care facilities.

Market Data | Jul 29, 2021
Construction employment lags or matches pre-pandemic level in 101 metro areas despite housing boom
Eighty metro areas had lower construction employment in June 2021 than February 2020.

Market Data | Jul 28, 2021
Marriott has the largest construction pipeline of U.S. franchise companies in Q2‘21
472 new hotels with 59,034 rooms opened across the United States during the first half of 2021.

Market Data | Jul 27, 2021
New York leads the U.S. hotel construction pipeline at the close of Q2‘21
Many hotel owners, developers, and management groups have used the operational downtime, caused by COVID-19’s impact on operating performance, as an opportunity to upgrade and renovate their hotels and/or redefine their hotels with a brand conversion.

Market Data | Jul 26, 2021
U.S. construction pipeline continues along the road to recovery
During the first and second quarters of 2021, the U.S. opened 472 new hotels with 59,034 rooms.

Market Data | Jul 21, 2021
Architecture Billings Index robust growth continues
AIA’s Architecture Billings Index (ABI) score for June remained at an elevated level of 57.1.

Market Data | Jul 20, 2021
Multifamily proposal activity maintains sizzling pace in Q2
Condos hit record high as all multifamily properties benefit from recovery.

Market Data | Jul 19, 2021
Construction employment trails pre-pandemic level in 39 states
Supply chain challenges, rising materials prices undermine demand.

Market Data | Jul 15, 2021
Producer prices for construction materials and services soar 26% over 12 months
Contractors cope with supply hitches, weak demand.


