


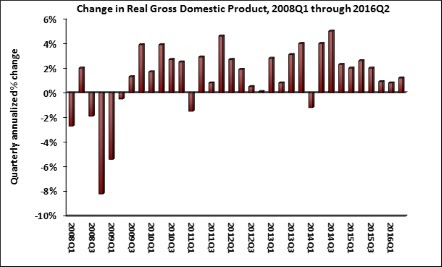
Real gross domestic product (GDP) expanded 1.2% (seasonally adjusted annual rate) during 2016’s second quarter according to according to an analysis of Bureau of Economic Analysis data released by Associated Builders and Contractors (ABC).
This modest figure follows a 0.8% annualized rate of output growth registered during the year’s first quarter.
Nonresidential fixed investment, a category closely tied to construction and other forms of business investment, fell for a third consecutive quarter, slipping 2.2% from the first quarter, with investment in structures declining 7.9%. Residential investment fell for the first time since the first quarter of 2014. Nonresidential investment in equipment fell 3.5% for the quarter, while nonresidential fixed investment in intellectual property expanded 3.5% and has now expanded for 12 consecutive quarters.
“Construction industry stakeholders should not have been anticipating a solid GDP report given previous weak construction spending and employment numbers that were recently released and they did not get one,” said Anirban Basu, ABC’s chief economist. “Today’s report suggests that construction activity has stalled a bit more than thought, largely due to slowing residential investment growth and low levels of public sector investment. With apartment rents no longer rising in a number of markets, the nation’s apartment building boom has taken a bit of a pause.
“Only those who sell directly to consumers and certain technology firms are likely to glean some sense of satisfaction from today’s release,” said Basu. “The balance of the economy continues to disappoint, though the lack of inventory building during the second quarter may help position the economy for a bounce-back during the third. It will be interesting to see if ABC’s Construction Backlog Indicator begins to show that average nonresidential construction firm backlog is now in decline, though many contractors continue to indicate that they remain busy due to previously secured work.
“It should be noted that the 7.9% decline in spending on structures during the second quarter transpired despite some very positive economic circumstances,” said Basu. “For instance, interest rates remain shockingly low, foreign investment continues to pour into U.S. commercial real estate, and there are positive wealth effects being generated by both housing and equity markets. However, it appears that even these conditions are no longer enough to support growing demand for construction spending. One could theorize that uncertainty originating from the current presidential election cycle is partially responsible.”
The following highlights emerged from today’s second quarter GDP release. All growth figures are seasonally adjusted annual rates:
- Personal consumption expenditures expanded 4.2% on an annualized basis during the second quarter of 2016 after growing 1.6% during the first quarter of 2016.
- Spending on goods rose 6.8% during the first quarter after expanding by 1.2% during the previous quarter.
- Real final sales of domestically produced output increased 2.4% in the second quarter after increasing 1.2% in the first.
- Federal government spending inched down by 0.2% in the year’s second quarter after contracting 1.5% in the first quarter of 2016.
- Nondefense government spending increased by 3.9% for the quarter following an increase of 0.9% in the first.
- National defense spending fell by 3% during the second quarter after registering a 3.2% decline in the previous quarter.
- State and local government spending fell by 1.3% in the second quarter after expanding 3.5% in the first quarter.
Related Stories

Market Data | Aug 4, 2020
7 must reads for the AEC industry today: August 4, 2020
Construction spending decreases for fourth consecutive month and 100% affordable housing development breaks ground in Mountain View.
Market Data | Aug 3, 2020
Construction spending decreases for fourth consecutive month in June
Association officials warn further contraction is likely unless federal government enacts prompt, major investment in infrastructure as state and local governments face deficits.

Market Data | Aug 3, 2020
6 must reads for the AEC industry today: August 3, 2020
The future is a number game for retail and restaurants and 5 reasons universities are renovating student housing.

Market Data | Jul 31, 2020
5 must reads for the AEC industry today: July 31, 2020
Vegas's newest resort and casino is packed with contactless technology and Mariott, Hilton, and IHG dominate the U.S. hotel construction pipeline.

Market Data | Jul 30, 2020
Marriott, Hilton, and IHG continue to dominate the U.S. hotel construction pipeline at Q2’20 close
Hilton’s Home2 Suites and IHG’s Holiday Inn Express continue to be the most prominent brands in the U.S. pipeline.

Market Data | Jul 30, 2020
7 must reads for the AEC industry today: July 30, 2020
Millennium Tower finally has a fix and construction costs decrease for the first time in 10 years.
Market Data | Jul 29, 2020
62% of metros shed construction jobs from June 2019 to June 2020 as Association calls for new infrastructure funding, other relief steps
New York City and Brockton-Bridgewater-Easton, Mass. have worst 12-month losses, while Austin and Walla Walla, Wash. top job gainers.

Market Data | Jul 29, 2020
6 must reads for the AEC industry today: July 29, 2020
The world's first net-zero airport and California utility adopts climate emergency declaration.

Market Data | Jul 28, 2020
For the fourth consecutive quarter, Los Angeles leads the U.S. hotel construction pipeline at the close of Q2’ 20
New York City continues to have the greatest number of projects under construction, with 106 projects/18,354 rooms.

Market Data | Jul 28, 2020
6 must reads for the AEC industry today: July 28, 2020
St. Petersburg Pier reconstruction completes and post-pandemic workplace design will not be the same for all.


