


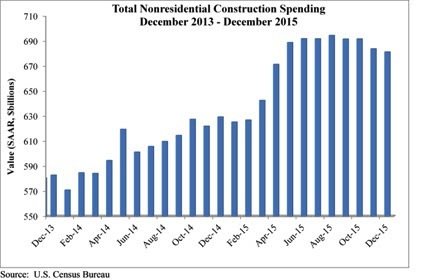
Nonresidential construction spending crested the $700 billion mark on a seasonally adjusted annualized basis in January for the first time since March 2009, according to analysis of U.S. Census Bureau data released today by Associated Builders and Contractors (ABC).
Nonresidential construction spending expanded 2.5% on a monthly basis and 12.3% on a yearly basis, totaling $701.9 billion. The Census Bureau upwardly revised December's estimate from $681.2 billion to $684.5 billion, though they downgraded November's figure from $683.7 to $680.5 million. Private nonresidential construction spending increased by 1% for the month, while its public counterpart expanded by 4.6%.
"After several months of relatively weak nonresidential construction spending data, today's data release was most welcome," ABC Chief Economist Anirban Basu said. "While January is a difficult month to interpret and one that should not be overly emphasized, the fact of the matter is that the year-over-year performance in spending is consistent with a host of industry indicators. For many months, the average contractor has been reporting decent backlog. Measures of industry confidence have remained stable even in the face of adverse news coming from various parts of the world.
"While the nonresidential construction spending recovery appears to remain in place, the industry's overall outlook remains murky," Basu said. "The global economy remains weak, and domestic corporate profitability has been slipping. The U.S. economic recovery continues to be under-diversified, with consumers continuing to lead the way. If corporate profitability continues to struggle, given falling exports and a general lack of confidence among CEOs, the pace of employment growth will slow over the course of 2016. That will presumably affect consumer spending, which is already being hampered by rising health care costs. That, in turn, could jeopardize the ongoing economic recovery, now on its way to completing its seventh year."
Spending increased in January on a monthly basis in 10 of 16 nonresidential construction sectors:
- Spending in the highway and street category expanded 14.6% from December 2015 and is 33.9 higher than in January 2015.
- Sewage and waste disposal-related spending expanded 4% for the month and 1.4% from the same time last year.
- Spending in the amusement and recreation category climbed 0.7% on a monthly basis and 16.9% on a year-over-year basis.
- Conservation and development-related spending is 10% higher on a monthly basis and 1.6% higher on a yearly basis.
- Lodging-related spending is up 6.3% for the month and is up 34.8% on a year-ago basis.
- Spending in the religious category grew 4.2% for the month and 0.2% from January 2015.
- Manufacturing-related spending expanded 4.2% on a monthly basis and is up 11.3% on a yearly basis.
- Spending in the power category expanded 2.9% from December 2015 and is 8.1% higher than in January 2015.
- Water supply-related spending expanded 2% on a monthly basis but fell 7.9% on a yearly basis.
- Spending in the office category grew 0.2% from December 2015 and is up 19.6% from January 2015.
Spending in six of the nonresidential construction subsectors fell in January on a monthly basis:
- Commercial-related construction spending fell 4.3% for the month but grew 0.8% on a year-over-year basis.
- Educational-related construction spending fell 1.1% on a monthly basis, but expanded 12.1% on a yearly basis.
- Transportation-related spending fell 2.5% month-over-month, but expanded 0.6% year-over-year.
- Health care-related spending fell 0.1% month-over-month but is up 1.8% year-over-year.
- Public safety-related spending is down 1.5% for the month and 3.2% from the same time one year ago.
- Communication-related spending fell by 4.2% month-over-month but expanded 27.2% year-over-year.
Related Stories

Market Data | Apr 4, 2023
Nonresidential construction spending up 0.4% in February 2023
National nonresidential construction spending increased 0.4% in February, according to an Associated Builders and Contractors analysis of data published by the U.S. Census Bureau. On a seasonally adjusted annualized basis, nonresidential spending totaled $982.2 billion for the month, up 16.8% from the previous year.

Multifamily Housing | Mar 24, 2023
Average size of new apartments dropped sharply in 2022
The average size of new apartments in 2022 dropped sharply in 2022, as tracked by RentCafe. Across the U.S., the average new apartment size was 887 sf, down 30 sf from 2021, which was the largest year-over-year decrease.

Multifamily Housing | Mar 14, 2023
Multifamily housing rent rates remain flat in February 2023
Multifamily housing asking rents remained the same for a second straight month in February 2023, at a national average rate of $1,702, according to the new National Multifamily Report from Yardi Matrix. As the economy continues to adjust in the post-pandemic period, year-over-year growth continued its ongoing decline.

Contractors | Mar 14, 2023
The average U.S. contractor has 9.2 months worth of construction work in the pipeline, as of February 2023
Associated Builders and Contractors reported today that its Construction Backlog Indicator increased to 9.2 months in February, according to an ABC member survey conducted Feb. 20 to March 6. The reading is 1.2 months higher than in February 2022.

Industry Research | Mar 9, 2023
Construction labor gap worsens amid more funding for new infrastructure, commercial projects
The U.S. construction industry needs to attract an estimated 546,000 additional workers on top of the normal pace of hiring in 2023 to meet demand for labor, according to a model developed by Associated Builders and Contractors. The construction industry averaged more than 390,000 job openings per month in 2022.

Market Data | Mar 7, 2023
AEC employees are staying with firms that invest in their brand
Hinge Marketing’s latest survey explores workers’ reasons for leaving, and offers strategies to keep them in the fold.

Multifamily Housing | Feb 21, 2023
Multifamily housing investors favoring properties in the Sun Belt
Multifamily housing investors are gravitating toward Sun Belt markets with strong job and population growth, according to new research from Yardi Matrix. Despite a sharp second-half slowdown, last year’s nationwide $187 billion transaction volume was the second-highest annual total ever.

Contractors | Feb 14, 2023
The average U.S. contractor has nine months worth of construction work in the pipeline
Associated Builders and Contractors reports today that its Construction Backlog Indicator declined 0.2 months to 9.0 in January, according to an ABC member survey conducted Jan. 20 to Feb. 3. The reading is 1.0 month higher than in January 2022.

Office Buildings | Feb 9, 2023
Post-Covid Manhattan office market rebound gaining momentum
Office workers in Manhattan continue to return to their workplaces in sufficient numbers for many of their employers to maintain or expand their footprint in the city, according to a survey of more than 140 major Manhattan office employers conducted in January by The Partnership for New York City.

Giants 400 | Feb 9, 2023
New Giants 400 download: Get the complete at-a-glance 2022 Giants 400 rankings in Excel
See how your architecture, engineering, or construction firm stacks up against the nation's AEC Giants. For more than 45 years, the editors of Building Design+Construction have surveyed the largest AEC firms in the U.S./Canada to create the annual Giants 400 report. This year, a record 519 firms participated in the Giants 400 report. The final report includes 137 rankings across 25 building sectors and specialty categories.


