


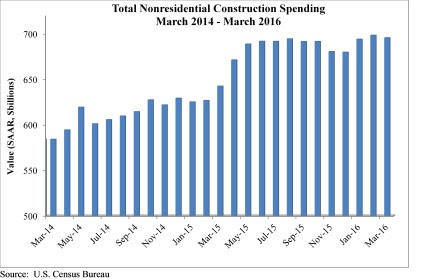
Nonresidential construction spending fell 0.4% on a monthly basis in March, according to analysis of U.S. Census Bureau data released today by Associated Builders and Contractors (ABC), but it was up 8.3% on a year-over-year basis to $695.7 billion. Eight of 16 nonresidential construction subsectors experienced monthly spending growth in March and twelve are up on a year-ago basis.
March would have recorded a monthly spending gain were it not for an upward revision to February's data (from $690.3 to $698.4 billion).
"Viewed optimistically, one can conclude that nonresidential construction has stabilized at a high level," said ABC Chief Economist Anirban Basu. "While the last several months have failed to deliver significant spending growth, many contractors indicate that they remain busy and that backlog levels are satisfactory. Still, one might have expected better spending growth performance given the combination of steady job growth nationally, large sums of capital coming from abroad and invested in the U.S. and surprisingly low interest rates.
"Based on recent trends, one concludes that many U.S. corporations remain reluctant to invest in large-scale projects," said Basu. "Nonresidential fixed investment has generally been soft over recent quarters, and has subtracted from GDP growth recently. America has been experiencing a corporate profits recession recently and slow growth. GDP expanded less than 2% on an annualized basis during last year's final quarter and less than 1% during this year's first. Combine that with hesitant government agencies, and one lacks a recipe for healthy nonresidential construction spending growth."
Spending has increased in 12 of the 16 construction subsectors over the past year. Three of the four sectors registering spending declines over that time — water supply, conservation and development, and public safety — rank among the four smallest subsectors. Each of these subsectors is also heavily influenced by public sector capital budgets.
Eight of 16 nonresidential construction sectors experienced spending increases in March on a monthly basis:
- Lodging-related spending was up 1% from February 2016 and is up 27.7% from March 2015;
- Health care-related spending expanded 1.6% month-over-month and is up 4.1% year-over-year;
- Commercial-related construction spending rose 1.2% for the month and 14.5% over the last year;
- Conservation and development-related spending was 1.6% higher on a monthly basis, but is 3.3% lower on a year-over-year basis.
- Spending in the religious category grew 5.2% for the month and is up 6.4% from March 2015.
- Manufacturing-related spending gained 2% on a monthly basis, but is down 2.1% on a year-over-year basis.
- Communication-related spending grew 3.7% month-over-month and has expanded 10.4% year-over-year.
- Spending in the highway and street category expanded 0.5% from February and is 18.8 higher than one year ago.
Spending in eight of the nonresidential construction subsectors fell in March on a monthly basis:
- Spending in the amusement and recreation category fell 1% from February, but is up 9.6% from the same month one year ago.
- Education-related construction spending fell 0.6% on a monthly basis, but has expanded 11.8% on a yearly basis.
- Sewage and waste disposal-related spending fell 4.2% for the month, but is up 3.8% from the same time one year ago.
- Spending in the power category was down 3.2% from February, but is up 0.8% from a year ago.
- Water supply-related spending fell 1.6% on a monthly basis and has declined 6.1% on a yearly basis.
- Spending in the office category declined 1.3% from February, but is up 19.5% on a year-ago basis.
- Transportation-related spending fell 2.1% month-over-month and has expanded 1.2% year-over-year.
- Public safety-related spending is down 7.8% for the month and 12.3% from March 2015.
Related Stories

| Dec 20, 2013
Top healthcare sector trends for 2014 (and beyond)
Despite the lack of clarity regarding many elements of healthcare reform, there are several core tenets that will likely continue to drive transition within the healthcare industry.

| Dec 20, 2013
Must see for the holidays: Architects re-create iconic structures using gingerbread
Gensler, PBK, Page Sutherland Page, and Kirksey were among the firms to compete in the 5th Annual Gingerbread Build-Off.

| Dec 20, 2013
Can energy hogs still be considered efficient buildings? Yes, say engineers at Buro Happold
A new tool from the engineering firm Buro Happold takes into account both energy and economic performance of buildings for a true measure of efficiency.

| Dec 20, 2013
Ten spectacular contemporary churches [slideshow]
German building-information provider Emporis compiles a photographic tour of inspirational spaces.

| Dec 19, 2013
NRDC report relates green infrastructure investments to commercial property value [Infographic]
The Natural Resources Defense Council has released The Green Edge: How Commercial Property Investment in Green Infrastructure Creates Value -- a first-ever illustrative and well-documented report that helps demonstrate the value of green infrastructure. It draws from available published material to capture the multitude of tangible, monetizable non-water quality and water quality benefits that green infrastructure investments (trees, rain gardens, and porous pavement, rainwater harvesting cisterns, bioswales, etc.) can unlock for the commercial real estate sector, including commercial property owners and their tenants.
| Dec 19, 2013
Mastering the art of crowd control and visitor flow in interpretive facilities
To say that visitor facility planning and design is challenging is an understatement. There are many factors that determine the success of a facility. Unfortunately, visitor flow, the way people move and how the facility accommodates those movements, isn’t always specifically considered.

| Dec 19, 2013
Urban populations, climate change demand resilient design: Report
With over fifty percent of the population already living in urban areas, cities must grapple with the potentially catastrophic effects of climate change (think: Superstorm Sandy in New York). In a new report, Jones Lang LaSalle has identified steps cities can take to make their infrastructure more resilient to changing climate conditions.

| Dec 18, 2013
Architecture Billings Index takes step back in November
After six months of steadily increasing demand for design services, the Architecture Billings Index paused in November, dipping below 50 for just the second time in 2013.

| Dec 17, 2013
NREL, National Trust offer energy roadmap for small buildings and small portfolios
The National Renewable Energy Laboratory and the National Trust for Historic Preservation’s Preservation Green Lab initiative have released the report “Industry Research and Recommendations for Small Buildings and Small Portfolios,” analyzing untapped opportunities in energy savings.

| Dec 17, 2013
Nation's largest net-zero K-12 school among winners of 2013 Best of Green Schools award
The Lady Bird Johnson Middle School in Irving, Texas, was named a winner of USGBC's annual award, along with nine other schools, individuals and communities working toward the common goal of healthy, high-performing learning places.


