


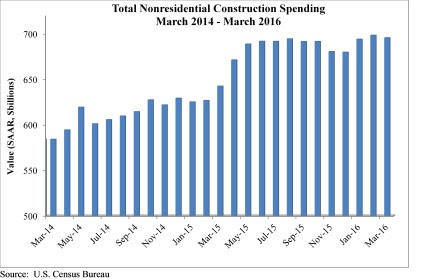
Nonresidential construction spending fell 0.4% on a monthly basis in March, according to analysis of U.S. Census Bureau data released today by Associated Builders and Contractors (ABC), but it was up 8.3% on a year-over-year basis to $695.7 billion. Eight of 16 nonresidential construction subsectors experienced monthly spending growth in March and twelve are up on a year-ago basis.
March would have recorded a monthly spending gain were it not for an upward revision to February's data (from $690.3 to $698.4 billion).
"Viewed optimistically, one can conclude that nonresidential construction has stabilized at a high level," said ABC Chief Economist Anirban Basu. "While the last several months have failed to deliver significant spending growth, many contractors indicate that they remain busy and that backlog levels are satisfactory. Still, one might have expected better spending growth performance given the combination of steady job growth nationally, large sums of capital coming from abroad and invested in the U.S. and surprisingly low interest rates.
"Based on recent trends, one concludes that many U.S. corporations remain reluctant to invest in large-scale projects," said Basu. "Nonresidential fixed investment has generally been soft over recent quarters, and has subtracted from GDP growth recently. America has been experiencing a corporate profits recession recently and slow growth. GDP expanded less than 2% on an annualized basis during last year's final quarter and less than 1% during this year's first. Combine that with hesitant government agencies, and one lacks a recipe for healthy nonresidential construction spending growth."
Spending has increased in 12 of the 16 construction subsectors over the past year. Three of the four sectors registering spending declines over that time — water supply, conservation and development, and public safety — rank among the four smallest subsectors. Each of these subsectors is also heavily influenced by public sector capital budgets.
Eight of 16 nonresidential construction sectors experienced spending increases in March on a monthly basis:
- Lodging-related spending was up 1% from February 2016 and is up 27.7% from March 2015;
- Health care-related spending expanded 1.6% month-over-month and is up 4.1% year-over-year;
- Commercial-related construction spending rose 1.2% for the month and 14.5% over the last year;
- Conservation and development-related spending was 1.6% higher on a monthly basis, but is 3.3% lower on a year-over-year basis.
- Spending in the religious category grew 5.2% for the month and is up 6.4% from March 2015.
- Manufacturing-related spending gained 2% on a monthly basis, but is down 2.1% on a year-over-year basis.
- Communication-related spending grew 3.7% month-over-month and has expanded 10.4% year-over-year.
- Spending in the highway and street category expanded 0.5% from February and is 18.8 higher than one year ago.
Spending in eight of the nonresidential construction subsectors fell in March on a monthly basis:
- Spending in the amusement and recreation category fell 1% from February, but is up 9.6% from the same month one year ago.
- Education-related construction spending fell 0.6% on a monthly basis, but has expanded 11.8% on a yearly basis.
- Sewage and waste disposal-related spending fell 4.2% for the month, but is up 3.8% from the same time one year ago.
- Spending in the power category was down 3.2% from February, but is up 0.8% from a year ago.
- Water supply-related spending fell 1.6% on a monthly basis and has declined 6.1% on a yearly basis.
- Spending in the office category declined 1.3% from February, but is up 19.5% on a year-ago basis.
- Transportation-related spending fell 2.1% month-over-month and has expanded 1.2% year-over-year.
- Public safety-related spending is down 7.8% for the month and 12.3% from March 2015.
Related Stories

BIM and Information Technology | May 27, 2015
4 projects honored with AIA TAP Innovation Awards for excellence in BIM and project delivery
Morphosis Architects' Emerson College building in Los Angeles and the University of Delaware’s ISE Lab are among the projects honored by AIA for their use of BIM/VDC tools.

Healthcare Facilities | May 27, 2015
Rochester, Minn., looks to escape Twin Cities’ shadow with $6.5 billion biotech development
The 20-year plan would also be a boon to Mayo Clinic, this city’s best-known address.

BIM and Information Technology | May 21, 2015
How AEC firms should approach BIM training
CASE Founding Partner Steve Sanderson talks about the current state of software training in the AEC industry and common pitfalls in AEC training.

Architects | May 20, 2015
Architecture billings remain stuck in winter slowdown
Regional business conditions continue to thrive in the South and West

University Buildings | May 19, 2015
Special Report: How your firm can help struggling colleges and universities meet their building project goals
Building Teams that want to succeed in the higher education market have to help their clients find new funding sources, control costs, and provide the maximum value for every dollar.

University Buildings | May 19, 2015
Renovate or build new: How to resolve the eternal question
With capital budgets strained, renovation may be an increasingly attractive money-saving option for many college and universities.

University Buildings | May 19, 2015
KU Jayhawks take a gander at a P3 development
The P3 concept is getting a tryout at the University of Kansas, where state funding for construction has fallen from 20% of project costs to about 11% over the last 10 years.

Retail Centers | May 18, 2015
ULI forecast sees clear skies for real estate over next three years
With asset availability declining in several sectors, rents and transactions should rise.

Contractors | May 18, 2015
Gilbane foresees double-digit growth in construction spending in 2015
In its Spring outlook, the construction company frets about hiring patterns that aren’t fully taking a project’s workload into account.

Architects | May 10, 2015
Harness the connection between managing risk and increasing profitability, Part 2
In Part 1, we covered taking control of the submittals schedule and managing RFIs. Let’s move on to properly allocating substitutions and limiting change orders.


