


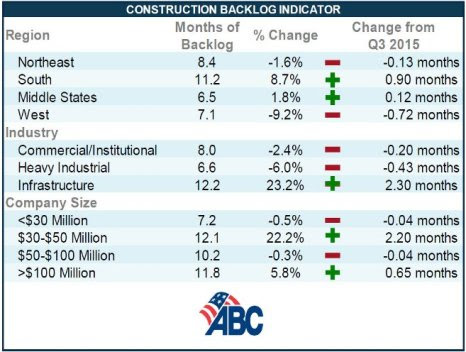
The South posted the highest backlog in the history of the Construction Backlog Indicator (CBI) in the fourth quarter of 2015, according to Associated Builders and Contractors (ABC).
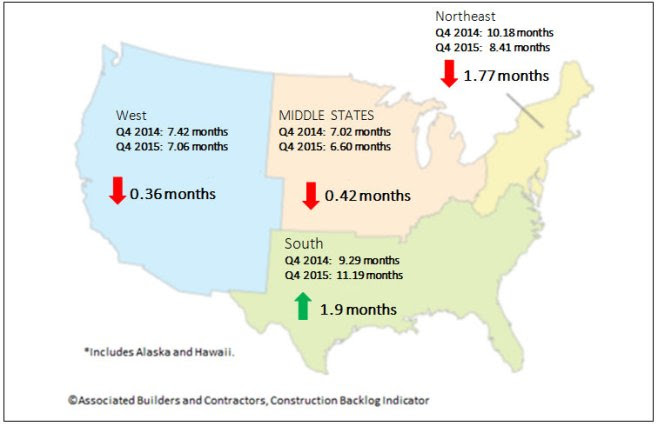
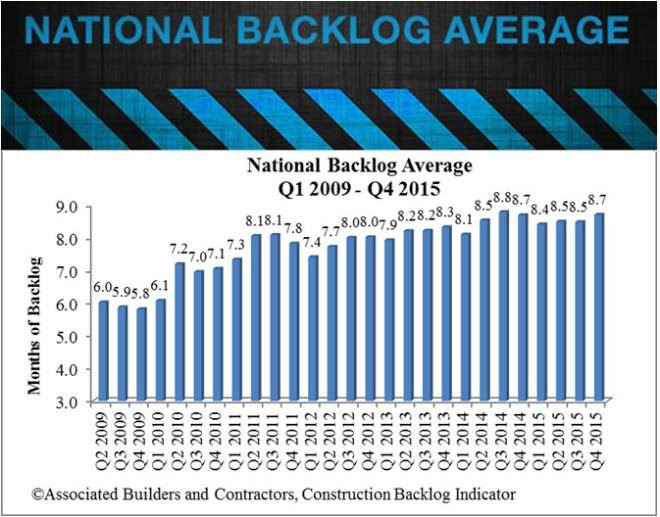
Nationally, backlog expanded by 2.7% to 8.7 months in the last three months of the year, with the South expanding on its previous record high reading by 8.7% to 11.19 months. In addition, infrastructure-related backlog expanded by 23.2% in the fourth quarter to 12.2 months.
"For the first time in years, some contractors are reporting that they are turning away work," ABC Chief Economist Anirban Basu said. "Skill-worker shortages are a frequently cited reason. The recent uptick in backlog suggests that demand for construction workers will remain elevated going forward, which will translate into faster wage growth, but also potentially rising costs and extended timelines.
"The nonresidential construction recovery remains very much in place," Basu said. "Despite disappointing news regarding global growth and corporate earnings, most contractors reported steady to rising backlog during 2015's final weeks. That's important to contractors, of course, but also to other economic stakeholders, since nonresidential construction spending growth has emerged as one of the nation's leading economic drivers.
"Nonresidential construction spending growth in January of 2016 was fully 12.3% its year-ago level," Basu said. "However, there were a number of months during the latter half of 2015 during which construction spending growth was soft. Accordingly, backlog expanded less rapidly during that period, including during the quarters that precede the fourth quarter's expansion."
For additional analysis click here.
Regional Highlights
- After a lull in backlog growth in Louisiana, several Louisiana contractors are reporting significant surges in backlog more recently. Louisiana is one of the nation's leading oil and natural gas suppliers. Some analysts have indicated that the state has been at risk of recession. But the ongoing expansion of the petrochemical sector as helped to rebuild backlog. Commercial activity has also begun to rebound in many communities.
- Backlog remains steady in the Northeast. The region has benefitted from stabilized federal government outlays, improving fiscal conditions in a handful of states and brisk commercial activity that is often linked to multifamily construction.
- Backlog in the West slipped during the year's initial quarter. There has been much speculation regarding excessively high technology company valuations. Many tech companies have expanded their physical capacity in recent years, and evidence suggests that this pace of expansion may have slowed somewhat. Still, backlog in the West remains above its level in the first half of 2015.
See Charts and Graphs.
Industry Highlights
- Backlog in the infrastructure category has reached an all-time high of 12.2 months. During the fourth quarter, backlog in this category increased by 2.3 months, a remarkable result and indicative of the quick impact of the newly passed federal highway spending bill – the first such bill to be passed in many years.
- Backlog in the heavy industrial category stands at 6.64 months, 6% lower than during the third quarter of 2015. This comes as little surprise as the nation's manufacturing sector sustained a 6% dip in exports last year. Additionally, the strong U.S. dollar has rendered imports more price competitive, suppressing domestic profit margins and construction.
- Backlog in the commercial/institutional category stands at more than 8 months. Backlog in this segment has stood at 8 months or better for 14 consecutive months, a reflection of the ongoing gradual economic recovery.
See Charts and Graphs.
Highlights by Company Size
- Backlog in the $30 million to $50 million annual revenue category now exceeds 12 months, the highest level in the history of this series. By contrast, average backlog during the fourth quarter of 2009 (six years ago) stood at 5.5 months.
- Backlog among the largest construction firms in the survey (+$100 million) expanded to 11.8 months during 2015's final quarter, the second highest level in the history of the series.
- Backlog in the $50 million to $100 million annual revenue category remains above 10 months and has been above that threshold during 12 of the last 14 quarters.
- Backlog among the smallest firms in the survey (>$30million) stood at 7.2 months during the four quarter, roughly the same as during the prior quarter. Backlog among this group of firms hardly changed over the course of 2015, though backlog presently is not as elevated on average as it was during in mid-2014.
See Charts and Graphs.
Related Stories

| Dec 20, 2013
Must see for the holidays: Architects re-create iconic structures using gingerbread
Gensler, PBK, Page Sutherland Page, and Kirksey were among the firms to compete in the 5th Annual Gingerbread Build-Off.

| Dec 20, 2013
Can energy hogs still be considered efficient buildings? Yes, say engineers at Buro Happold
A new tool from the engineering firm Buro Happold takes into account both energy and economic performance of buildings for a true measure of efficiency.

| Dec 20, 2013
Ten spectacular contemporary churches [slideshow]
German building-information provider Emporis compiles a photographic tour of inspirational spaces.

| Dec 19, 2013
NRDC report relates green infrastructure investments to commercial property value [Infographic]
The Natural Resources Defense Council has released The Green Edge: How Commercial Property Investment in Green Infrastructure Creates Value -- a first-ever illustrative and well-documented report that helps demonstrate the value of green infrastructure. It draws from available published material to capture the multitude of tangible, monetizable non-water quality and water quality benefits that green infrastructure investments (trees, rain gardens, and porous pavement, rainwater harvesting cisterns, bioswales, etc.) can unlock for the commercial real estate sector, including commercial property owners and their tenants.

| Dec 19, 2013
Mastering the art of crowd control and visitor flow in interpretive facilities
To say that visitor facility planning and design is challenging is an understatement. There are many factors that determine the success of a facility. Unfortunately, visitor flow, the way people move and how the facility accommodates those movements, isn’t always specifically considered.

| Dec 19, 2013
Urban populations, climate change demand resilient design: Report
With over fifty percent of the population already living in urban areas, cities must grapple with the potentially catastrophic effects of climate change (think: Superstorm Sandy in New York). In a new report, Jones Lang LaSalle has identified steps cities can take to make their infrastructure more resilient to changing climate conditions.

| Dec 18, 2013
Architecture Billings Index takes step back in November
After six months of steadily increasing demand for design services, the Architecture Billings Index paused in November, dipping below 50 for just the second time in 2013.

| Dec 17, 2013
NREL, National Trust offer energy roadmap for small buildings and small portfolios
The National Renewable Energy Laboratory and the National Trust for Historic Preservation’s Preservation Green Lab initiative have released the report “Industry Research and Recommendations for Small Buildings and Small Portfolios,” analyzing untapped opportunities in energy savings.

| Dec 17, 2013
Nation's largest net-zero K-12 school among winners of 2013 Best of Green Schools award
The Lady Bird Johnson Middle School in Irving, Texas, was named a winner of USGBC's annual award, along with nine other schools, individuals and communities working toward the common goal of healthy, high-performing learning places.

| Dec 17, 2013
IBM's five tech-driven innovation predictions for the next five years [infographics]
Smart classrooms, DNA-based medical care, and wired cities are among the technology-related innovations identified by IBM researchers for the company's 5 in 5 report.


