


The Lodging Econometrics (LE) global construction pipeline trend report, which compiles the construction pipeline for every country and market in the world, states that the total pipeline stands at 12,714 projects/2,139,002 rooms, up 7% by projects year-over-year (YOY).
There are 5,952 projects/1,115,288 rooms under construction, up 8% by projects YOY. Projects scheduled to start construction in the next 12 months, at 3,988 projects/584,433 rooms, are up 6% while projects in early planning at 2,774 projects/439,281 rooms are up 5% YOY.
The leading 5 franchise companies in the global construction pipeline by project-count are: Marriott International with 2,381 projects/398,238 rooms, Hilton Worldwide with 2,180 projects/322,857 rooms, InterContinental Hotels Group (IHG) with 1,600 projects/234,807 rooms, AccorHotels with 781 projects/140,396 rooms, and Choice Hotels with 629 projects/153,992 rooms. The leading brands for each of these companies are: Marriott’s Fairfield Inn with 357 projects/38,826 rooms, Hilton’s Hampton Inn & Suites with 599 projects/75,642 rooms, IHG’s Holiday Inn Express with 709 projects/86,836 rooms, Accor’s Ibis with 156 projects/22,361 rooms, and Choice’s Comfort Suites with 126 projects/10,983 rooms.
Related Stories
Market Data | Jun 3, 2020
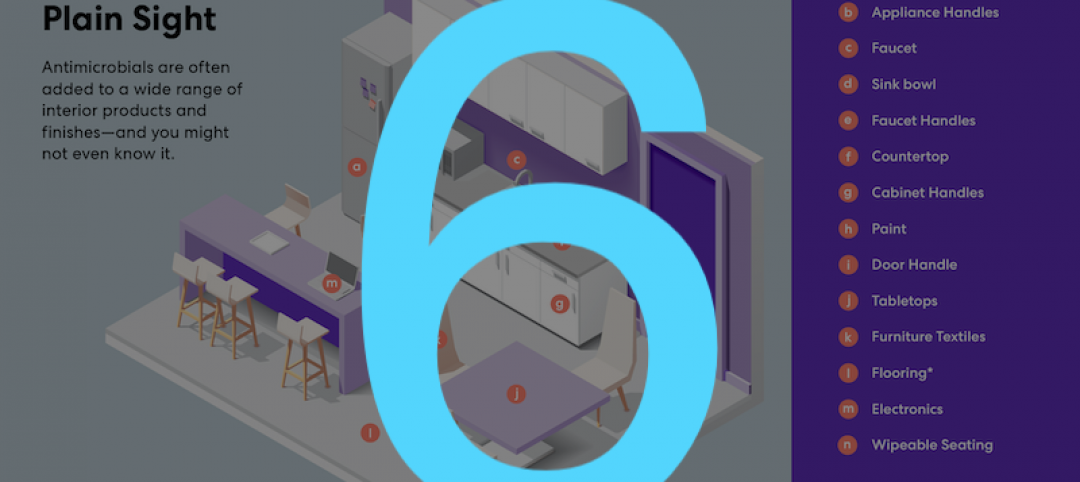
6 must reads for the AEC industry today: June 3, 2020
5 ways to improve cleanliness of public restrooms and office owners are in no hurry for tenants to return.

Market Data | Jun 2, 2020
Architects, health experts release strategies, tools for safely reopening buildings
AIA issues three new and enhanced tools for reducing risk of COVID-19 transmission in buildings.

Market Data | Jun 2, 2020
5 must reads for the AEC industry today: June 2, 2020
New Luxembourg office complex breaks ground and nonresidential construction spending falls.
Market Data | Jun 1, 2020
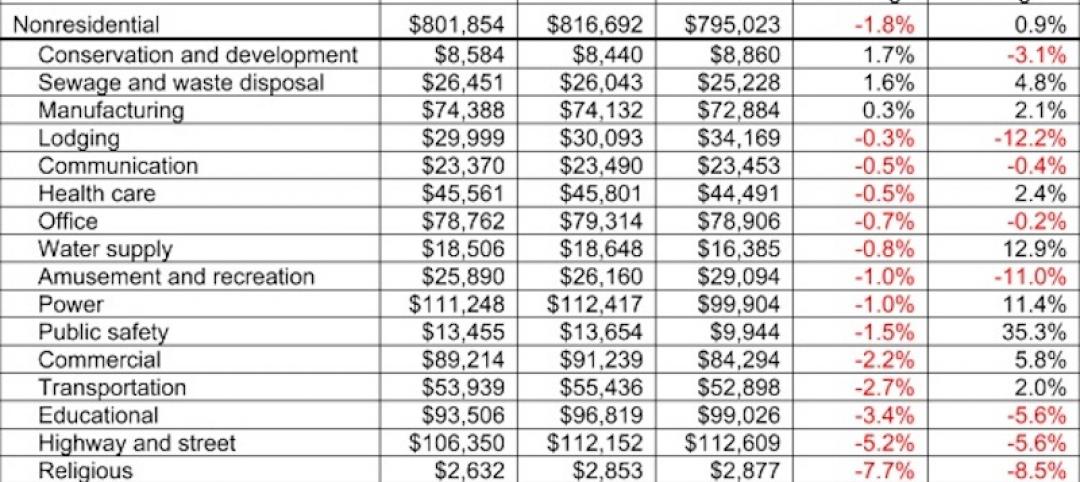
Nonresidential construction spending falls in April
Of the 16 subcategories, 13 were down on a monthly basis.
Market Data | Jun 1, 2020
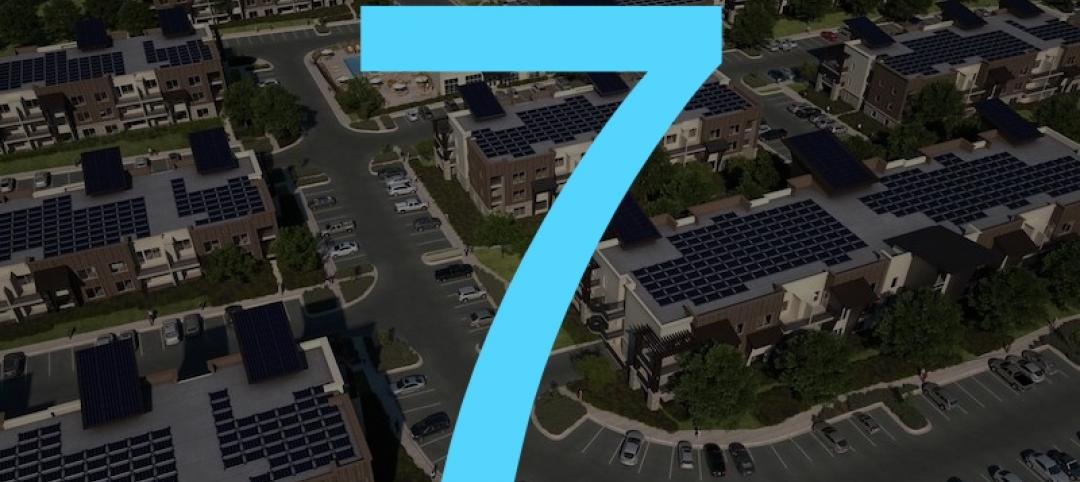
7 must reads for the AEC industry today: June 1, 2020
Energy storage as an amenity and an entry-point for wellness screening everywhere.

Market Data | May 29, 2020
House-passed bill making needed improvements to paycheck protection program will allow construction firms to save more jobs
Construction official urges senate and White House to quickly pass and sign into law the Paycheck Protection Program Flexibility Act.

Market Data | May 29, 2020
7 must reads for the AEC industry today: May 29, 2020
Using lighting IoT data to inform a safer office reentry strategy and Ghafari joins forces with Eview 360.

Market Data | May 27, 2020
5 must reads for the AEC industry today: May 28, 2020
Biophilic design on the High Line and the office market could be a COVID-19 casualty.

Market Data | May 27, 2020
6 must reads for the AEC industry today: May 27, 2020
AIA's COTE Top Ten Awards and OSHA now requires employers to track COVID-19 cases.

Market Data | May 26, 2020
6 must reads for the AEC industry today: May 26, 2020
Apple's new Austin hotel and is CLT really a green solution?


