


With an average cost per square foot of $16.11, Stamford, Conn., is the most costly U.S. market for commercial real estate, according to a new study by the Building Owners and Managers Association International. New York and San Francisco are also among the nation's priciest markets.
Using the results from the BOMA 2013 Experience Exchange Report, the group compiled a list of the most and least expensive commercial real estate city-markets in the United States. The annual report aggregates rental income and operating expense figures from the previous year; in 2012, data was gathered from more than 5,300 buildings across 250 markets and 115 cities in the United States and Canada.
Five most expensive city-markets – total operating expenses:
1. Stamford, Conn. $16.11 per square foot (psf)
2. New York $11.80 psf
3. Grand Rapids, Mich. $11.16 psf
4. Newark, N.J. $10.34 psf
5. San Francisco $9.66 psf
Five least expensive city-markets – total operating expenses:
1. Stockton, Calif. $3.57 psf
2. Fresno, Calif. $3.61 psf
3. Huntsville, Ala. $4.31 psf
4. Virginia Beach, Va. $4.64 psf
5. Albuquerque, N.M. $4.80 psf
Total operating expenses incorporate all expenses incurred to operate office buildings, including utilities, repairs and maintenance, roads and grounds, cleaning, administration, and security. Fixed expenses include real estate taxes, property taxes and insurance.
There was a 3.9 percent overall decrease in total operating expenses from 2011 to 2012, underscoring an industry focus on maximizing building efficiency in the face of dwindling income streams. For example, New York, which topped the list of most expensive markets for operating expenses last year, saw a decrease of $0.66 per square foot.
Five most expensive city-markets – total rental income:
1. Washington, D.C. $44.30 psf
2. New York $39.00 psf
3. San Mateo, Calif. $34.96 psf
4. San Francisco $34.49 psf
5. Santa Monica, Calif. $34.04 psf
Five least expensive city-markets – total rental income:
1. Macon, Ga. $8.16 psf
2. Shreveport, La. $11.18 psf
3. Columbus, Ohio $12.09 psf
4. Huntsville, Ala. $12.81 psf
5. Little Rock, Ark. $12.81 psf
Total rental income includes rental income from office, retail and other space, such as storage areas.
While average rental income has dropped somewhat, decreasing 2.9 percent from 2011 to 2012, building owners and managers are compensating for these income losses with greater reductions in expenses.
The Experience Exchange Report is the premier income and expense data benchmarking tool for the commercial real estate industry. The EER allows users to conduct multi-year analysis of single markets and select multiple cities to generate state and regional reports. It also offers the capability to search by building size, height, age and more for broader analysis. Subscriptions are available at www.bomaeer.com.
About BOMA International
The Building Owners and Managers Association (BOMA) International is a federation of 93 BOMA U.S. associations, BOMA Canada and its 11 regional associations and 13 BOMA international affiliates. Founded in 1907, BOMA represents the owners and managers of all commercial property types, including nearly 10 billion square feet of U.S. office space that supports 3.7 million jobs and contributes $205 billion to the U.S. GDP. Its mission is to advance the interests of the entire commercial real estate industry through advocacy, education, research, standards and information. Find BOMA online at www.boma.org.
Related Stories
| Feb 15, 2011
New 2030 Challenge to include carbon footprint of building materials and products
Architecture 2030 has just broadened the scope of its 2030 Challenge, issuing an additional challenge regarding the climate impact of building products. The 2030 Challenge for Products aims to reduce the embodied carbon (meaning the carbon emissions equivalent) of building products 50% by 2030.

| Feb 14, 2011
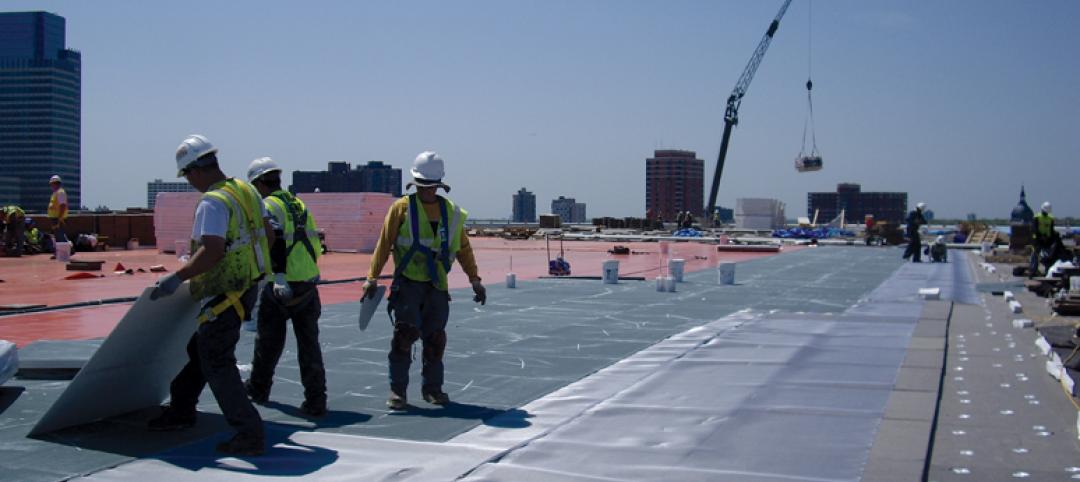
Sustainable Roofing: A Whole-Building Approach
According to sustainability experts, the first step toward designing an energy-efficient roofing system is to see roof materials and systems as an integral component of the enclosure and the building as a whole. Earn 1.0 AIA/CES learning units by studying this article and successfully completing the online exam.
| Feb 14, 2011
More companies willing to pay extra for green office space
New CoreNet Global/Jones Lang LaSalle survey shows real estate executives forging green strategies that balance environmental, financial and workforce issues.
| Feb 11, 2011
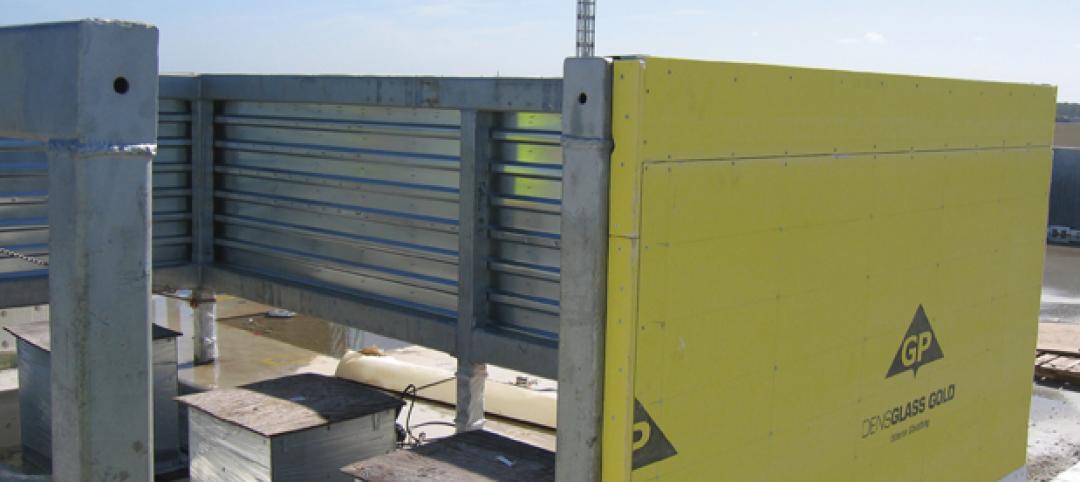
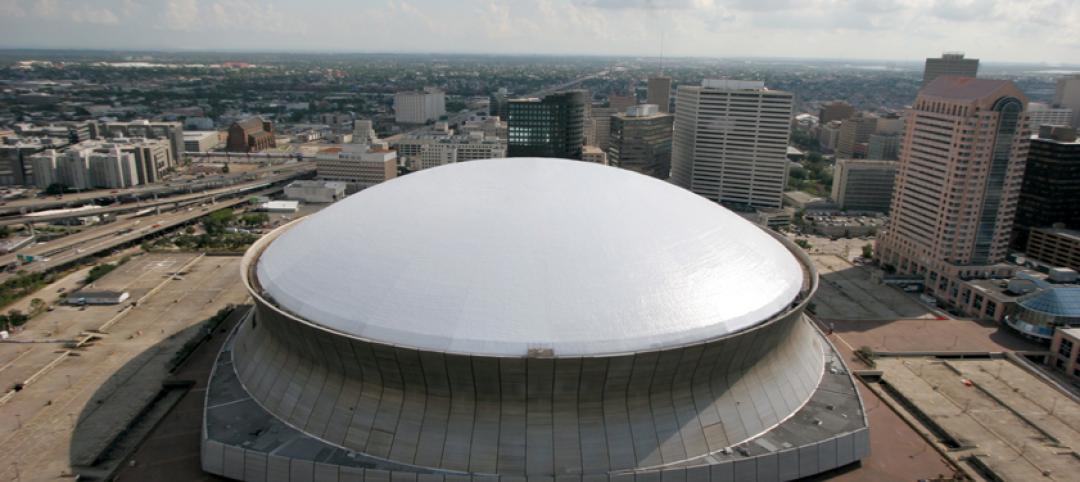
Four Products That Stand Up to Hurricanes
What do a panelized wall system, a newly developed roof hatch, spray polyurethane foam, and a custom-made curtain wall have in common? They’ve been extensively researched and tested for their ability to take abuse from the likes of Hurricane Katrina.
| Feb 11, 2011
RS Means Cost Comparison Chart: Office Buildings
This month's RS Means Cost Comparison Chart focuses on office building construction.
| Feb 11, 2011
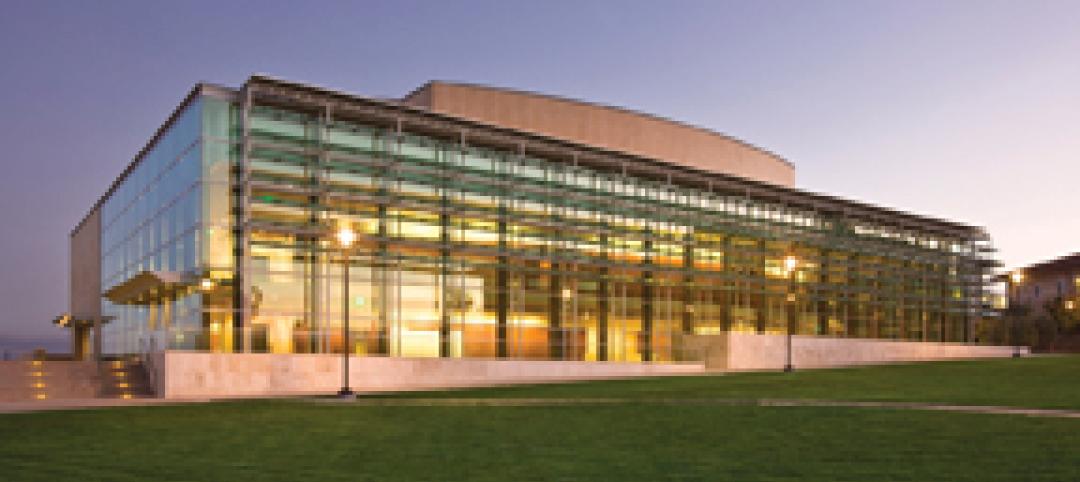
Sustainable features on the bill for dual-building performing arts center at Soka University of America
The $73 million Soka University of America’s new performing arts center and academic complex recently opened on the school’s Aliso Viejo, Calif., campus. McCarthy Building Companies and Zimmer Gunsul Frasca Architects collaborated on the two-building project. One is a three-story, 47,836-sf facility with a grand reception lobby, a 1,200-seat auditorium, and supports spaces. The other is a four-story, 48,974-sf facility with 11 classrooms, 29 faculty offices, a 150-seat black box theater, rehearsal/dance studio, and support spaces. The project, which has a green roof, solar panels, operable windows, and sun-shading devices, is going for LEED Silver.


