


With an average cost per square foot of $16.11, Stamford, Conn., is the most costly U.S. market for commercial real estate, according to a new study by the Building Owners and Managers Association International. New York and San Francisco are also among the nation's priciest markets.
Using the results from the BOMA 2013 Experience Exchange Report, the group compiled a list of the most and least expensive commercial real estate city-markets in the United States. The annual report aggregates rental income and operating expense figures from the previous year; in 2012, data was gathered from more than 5,300 buildings across 250 markets and 115 cities in the United States and Canada.
Five most expensive city-markets – total operating expenses:
1. Stamford, Conn. $16.11 per square foot (psf)
2. New York $11.80 psf
3. Grand Rapids, Mich. $11.16 psf
4. Newark, N.J. $10.34 psf
5. San Francisco $9.66 psf
Five least expensive city-markets – total operating expenses:
1. Stockton, Calif. $3.57 psf
2. Fresno, Calif. $3.61 psf
3. Huntsville, Ala. $4.31 psf
4. Virginia Beach, Va. $4.64 psf
5. Albuquerque, N.M. $4.80 psf
Total operating expenses incorporate all expenses incurred to operate office buildings, including utilities, repairs and maintenance, roads and grounds, cleaning, administration, and security. Fixed expenses include real estate taxes, property taxes and insurance.
There was a 3.9 percent overall decrease in total operating expenses from 2011 to 2012, underscoring an industry focus on maximizing building efficiency in the face of dwindling income streams. For example, New York, which topped the list of most expensive markets for operating expenses last year, saw a decrease of $0.66 per square foot.
Five most expensive city-markets – total rental income:
1. Washington, D.C. $44.30 psf
2. New York $39.00 psf
3. San Mateo, Calif. $34.96 psf
4. San Francisco $34.49 psf
5. Santa Monica, Calif. $34.04 psf
Five least expensive city-markets – total rental income:
1. Macon, Ga. $8.16 psf
2. Shreveport, La. $11.18 psf
3. Columbus, Ohio $12.09 psf
4. Huntsville, Ala. $12.81 psf
5. Little Rock, Ark. $12.81 psf
Total rental income includes rental income from office, retail and other space, such as storage areas.
While average rental income has dropped somewhat, decreasing 2.9 percent from 2011 to 2012, building owners and managers are compensating for these income losses with greater reductions in expenses.
The Experience Exchange Report is the premier income and expense data benchmarking tool for the commercial real estate industry. The EER allows users to conduct multi-year analysis of single markets and select multiple cities to generate state and regional reports. It also offers the capability to search by building size, height, age and more for broader analysis. Subscriptions are available at www.bomaeer.com.
About BOMA International
The Building Owners and Managers Association (BOMA) International is a federation of 93 BOMA U.S. associations, BOMA Canada and its 11 regional associations and 13 BOMA international affiliates. Founded in 1907, BOMA represents the owners and managers of all commercial property types, including nearly 10 billion square feet of U.S. office space that supports 3.7 million jobs and contributes $205 billion to the U.S. GDP. Its mission is to advance the interests of the entire commercial real estate industry through advocacy, education, research, standards and information. Find BOMA online at www.boma.org.
Related Stories

Sponsored | | Mar 21, 2014
Kameleon Color paint creates color-changing, iridescent exterior for Exploration Tower at Port Canaveral
Linetec finishes Firestone’s UNA-CLAD panels, achieving a one-of-a-kind, dynamic appearance with the first use of Valspar’s new Kameleon Color

| Mar 21, 2014
Forget wood skyscrapers - Check out these stunning bamboo high-rise concepts [slideshow]
The Singapore Bamboo Skyscraper competition invited design teams to explore the possibilities of using bamboo as the dominant material in a high-rise project for the Singapore skyline.

| Mar 20, 2014
Common EIFS failures, and how to prevent them
Poor workmanship, impact damage, building movement, and incompatible or unsound substrate are among the major culprits of EIFS problems.

| Mar 20, 2014
D.C. breaks ground on $2B mega waterfront development [slideshow]
When complete, the Wharf will feature approximately 3 million sf of new residential, office, hotel, retail, cultural, and public uses, including waterfront parks, promenades, piers, and docks.
| Mar 20, 2014
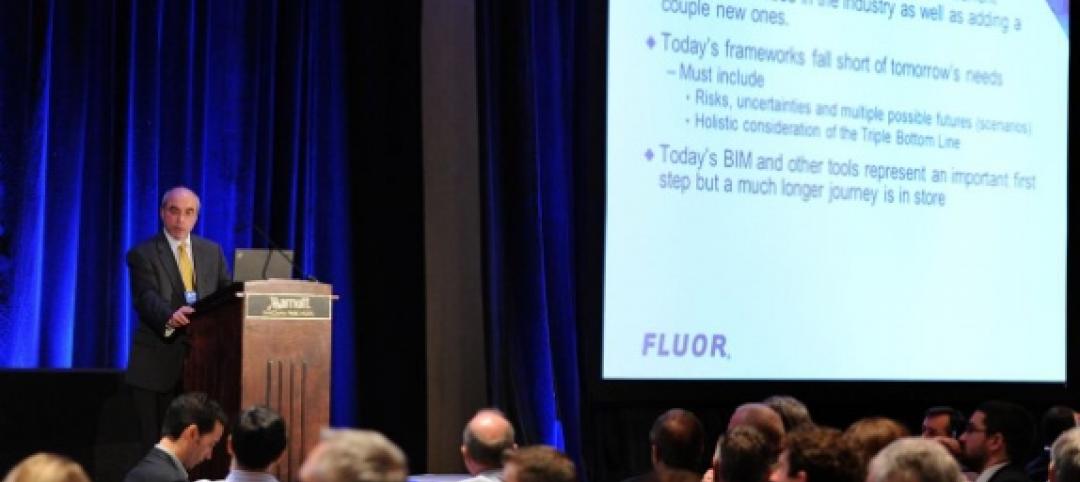
Fluor defines the future 7D deliverable without losing sight of real results today
A fascinating client story by Fluor SVP Robert Prieto reminds us that sometimes it’s the simplest details that can bring about real results today—and we shouldn’t overlook them, even as we push to change the future state of project facilitation.

| Mar 19, 2014
Is it time to start selecting your own clients?
Will 2014 be the year that design firms start selecting the clients they want rather than getting in line with competitors to respond to RFPs? That’s the question posed by a recent thought-provoking article.
| Mar 19, 2014
How to develop a healthcare capital project using a 'true north charter'
Because healthcare projects take years to implement, developing a true north charter is essential for keeping the entire team on track and moving in the right direction.

| Mar 18, 2014
6 keys to better healthcare design
Healthcare facility planning and design experts cite six factors that Building Teams need to keep in mind on their next healthcare project.

| Mar 18, 2014
How your AEC firm can win more healthcare projects
Cutthroat competition and the vagaries of the Affordable Healthcare Act are making capital planning a more daunting task than ever. Our experts provide inside advice on how AEC firms can secure more work from hospital systems.

| Mar 17, 2014
Rem Koolhaas explains China's plans for its 'ghost cities'
China's goal, according to Koolhaas, is to de-incentivize migration into already overcrowded cities.


