


With an average cost per square foot of $16.11, Stamford, Conn., is the most costly U.S. market for commercial real estate, according to a new study by the Building Owners and Managers Association International. New York and San Francisco are also among the nation's priciest markets.
Using the results from the BOMA 2013 Experience Exchange Report, the group compiled a list of the most and least expensive commercial real estate city-markets in the United States. The annual report aggregates rental income and operating expense figures from the previous year; in 2012, data was gathered from more than 5,300 buildings across 250 markets and 115 cities in the United States and Canada.
Five most expensive city-markets – total operating expenses:
1. Stamford, Conn. $16.11 per square foot (psf)
2. New York $11.80 psf
3. Grand Rapids, Mich. $11.16 psf
4. Newark, N.J. $10.34 psf
5. San Francisco $9.66 psf
Five least expensive city-markets – total operating expenses:
1. Stockton, Calif. $3.57 psf
2. Fresno, Calif. $3.61 psf
3. Huntsville, Ala. $4.31 psf
4. Virginia Beach, Va. $4.64 psf
5. Albuquerque, N.M. $4.80 psf
Total operating expenses incorporate all expenses incurred to operate office buildings, including utilities, repairs and maintenance, roads and grounds, cleaning, administration, and security. Fixed expenses include real estate taxes, property taxes and insurance.
There was a 3.9 percent overall decrease in total operating expenses from 2011 to 2012, underscoring an industry focus on maximizing building efficiency in the face of dwindling income streams. For example, New York, which topped the list of most expensive markets for operating expenses last year, saw a decrease of $0.66 per square foot.
Five most expensive city-markets – total rental income:
1. Washington, D.C. $44.30 psf
2. New York $39.00 psf
3. San Mateo, Calif. $34.96 psf
4. San Francisco $34.49 psf
5. Santa Monica, Calif. $34.04 psf
Five least expensive city-markets – total rental income:
1. Macon, Ga. $8.16 psf
2. Shreveport, La. $11.18 psf
3. Columbus, Ohio $12.09 psf
4. Huntsville, Ala. $12.81 psf
5. Little Rock, Ark. $12.81 psf
Total rental income includes rental income from office, retail and other space, such as storage areas.
While average rental income has dropped somewhat, decreasing 2.9 percent from 2011 to 2012, building owners and managers are compensating for these income losses with greater reductions in expenses.
The Experience Exchange Report is the premier income and expense data benchmarking tool for the commercial real estate industry. The EER allows users to conduct multi-year analysis of single markets and select multiple cities to generate state and regional reports. It also offers the capability to search by building size, height, age and more for broader analysis. Subscriptions are available at www.bomaeer.com.
About BOMA International
The Building Owners and Managers Association (BOMA) International is a federation of 93 BOMA U.S. associations, BOMA Canada and its 11 regional associations and 13 BOMA international affiliates. Founded in 1907, BOMA represents the owners and managers of all commercial property types, including nearly 10 billion square feet of U.S. office space that supports 3.7 million jobs and contributes $205 billion to the U.S. GDP. Its mission is to advance the interests of the entire commercial real estate industry through advocacy, education, research, standards and information. Find BOMA online at www.boma.org.
Related Stories

| Sep 24, 2014
Frank Gehry's first building in Latin America will host grand opening on Oct. 2
Gehry's design for the Biomuseo, or Museum of Biodiversity, draws inspiration from the site's natural and cultural surroundings, including local Panamaian tin roofs.

| Sep 23, 2014
Cedars-Sinai looks to streamline trauma care with first-of-its-kind OR360 simulation space
The breakthrough simulation center features moveable walls and a modular ceiling grid that allow doctors and military personnel to easily reconfigure the shape and size of the space.

| Sep 23, 2014
Third phase of New York’s High Line redevelopment opens
The $35 million Phase 3, known as High Line at the Rail Yards, broke ground September 20, 2012, and officially opened to the public on September 21.

| Sep 23, 2014
Cloud-shaped skyscraper complex wins Shenzhen Bay Super City design competition
Forget the cubist, clinical, glass and concrete jungle of today's financial districts. Shenzhen's new plan features a complex of cloud-shaped skyscrapers connected to one another with sloping bridges.

| Sep 23, 2014
Designing with Water: Report analyzes ways coastal cities can cope with flooding
The report contains 12 case studies of cities around the world that have applied advanced flood management techniques.
| Sep 22, 2014
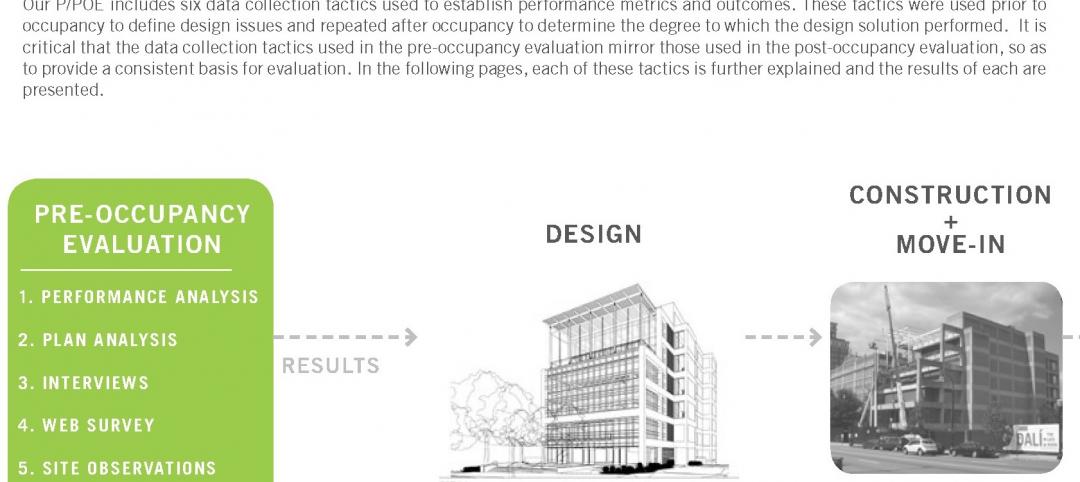
4 keys to effective post-occupancy evaluations
Perkins+Will's Janice Barnes covers the four steps that designers should take to create POEs that provide design direction and measure design effectiveness.

| Sep 22, 2014
Biloxi’s new Maritime and Seafood Industry Museum is like a ship in a bottle
Nine years after the Museum of Maritime and Seafood Industry in Biloxi, Miss., was damaged by Hurricane Katrina’s 30-foot tidal surge, the museum reopened its doors in a brand new, H3-designed building.
| Sep 22, 2014
Open plenum vs. dropped ceiling: The debate over life cycle cost
While suspended, lay-in ceilings have long been the norm in commercial design, the open-plenum ceiling has become trendy and economical, particularly in office and retail environments. However, calculating the tradeoffs between cost and performance can be tricky.

| Sep 22, 2014
USGBC names 2014 Best of Buildings Award winners
The Best of Building Awards celebrate the year’s best products, projects, organizations and individuals making an impact in green building.

| Sep 22, 2014
Sound selections: 12 great choices for ceilings and acoustical walls
From metal mesh panels to concealed-suspension ceilings, here's our roundup of the latest acoustical ceiling and wall products.


