


With an average cost per square foot of $16.11, Stamford, Conn., is the most costly U.S. market for commercial real estate, according to a new study by the Building Owners and Managers Association International. New York and San Francisco are also among the nation's priciest markets.
Using the results from the BOMA 2013 Experience Exchange Report, the group compiled a list of the most and least expensive commercial real estate city-markets in the United States. The annual report aggregates rental income and operating expense figures from the previous year; in 2012, data was gathered from more than 5,300 buildings across 250 markets and 115 cities in the United States and Canada.
Five most expensive city-markets – total operating expenses:
1. Stamford, Conn. $16.11 per square foot (psf)
2. New York $11.80 psf
3. Grand Rapids, Mich. $11.16 psf
4. Newark, N.J. $10.34 psf
5. San Francisco $9.66 psf
Five least expensive city-markets – total operating expenses:
1. Stockton, Calif. $3.57 psf
2. Fresno, Calif. $3.61 psf
3. Huntsville, Ala. $4.31 psf
4. Virginia Beach, Va. $4.64 psf
5. Albuquerque, N.M. $4.80 psf
Total operating expenses incorporate all expenses incurred to operate office buildings, including utilities, repairs and maintenance, roads and grounds, cleaning, administration, and security. Fixed expenses include real estate taxes, property taxes and insurance.
There was a 3.9 percent overall decrease in total operating expenses from 2011 to 2012, underscoring an industry focus on maximizing building efficiency in the face of dwindling income streams. For example, New York, which topped the list of most expensive markets for operating expenses last year, saw a decrease of $0.66 per square foot.
Five most expensive city-markets – total rental income:
1. Washington, D.C. $44.30 psf
2. New York $39.00 psf
3. San Mateo, Calif. $34.96 psf
4. San Francisco $34.49 psf
5. Santa Monica, Calif. $34.04 psf
Five least expensive city-markets – total rental income:
1. Macon, Ga. $8.16 psf
2. Shreveport, La. $11.18 psf
3. Columbus, Ohio $12.09 psf
4. Huntsville, Ala. $12.81 psf
5. Little Rock, Ark. $12.81 psf
Total rental income includes rental income from office, retail and other space, such as storage areas.
While average rental income has dropped somewhat, decreasing 2.9 percent from 2011 to 2012, building owners and managers are compensating for these income losses with greater reductions in expenses.
The Experience Exchange Report is the premier income and expense data benchmarking tool for the commercial real estate industry. The EER allows users to conduct multi-year analysis of single markets and select multiple cities to generate state and regional reports. It also offers the capability to search by building size, height, age and more for broader analysis. Subscriptions are available at www.bomaeer.com.
About BOMA International
The Building Owners and Managers Association (BOMA) International is a federation of 93 BOMA U.S. associations, BOMA Canada and its 11 regional associations and 13 BOMA international affiliates. Founded in 1907, BOMA represents the owners and managers of all commercial property types, including nearly 10 billion square feet of U.S. office space that supports 3.7 million jobs and contributes $205 billion to the U.S. GDP. Its mission is to advance the interests of the entire commercial real estate industry through advocacy, education, research, standards and information. Find BOMA online at www.boma.org.
Related Stories

| Dec 28, 2014
Robots, drones, and printed buildings: The promise of automated construction
Building Teams across the globe are employing advanced robotics to simplify what is inherently a complex, messy process—construction.

BIM and Information Technology | Dec 28, 2014
The Big Data revolution: How data-driven design is transforming project planning
There are literally hundreds of applications for deep analytics in planning and design projects, not to mention the many benefits for construction teams, building owners, and facility managers. We profile some early successful applications.
 Campus, the Building Team took advantage of the sites natural coastal g")
| Dec 28, 2014
AIA course: Enhancing interior comfort while improving overall building efficacy
Providing more comfortable conditions to building occupants has become a top priority in today’s interior designs. This course is worth 1.0 AIA LU/HSW.

| Dec 28, 2014
6 trends steering today's college residence halls
University students want more in a residence hall than just a place to sleep. They want a space that reflects their style of living and learning.
")
| Dec 28, 2014
Using energy modeling to increase project value [AIA course]
This course, worth 1.0 AIA LU/HSW, explores how to increase project value through energy modeling, as well as how to conduct quick payback and net present value studies to identify which energy strategies are most viable for the project.
| Dec 28, 2014
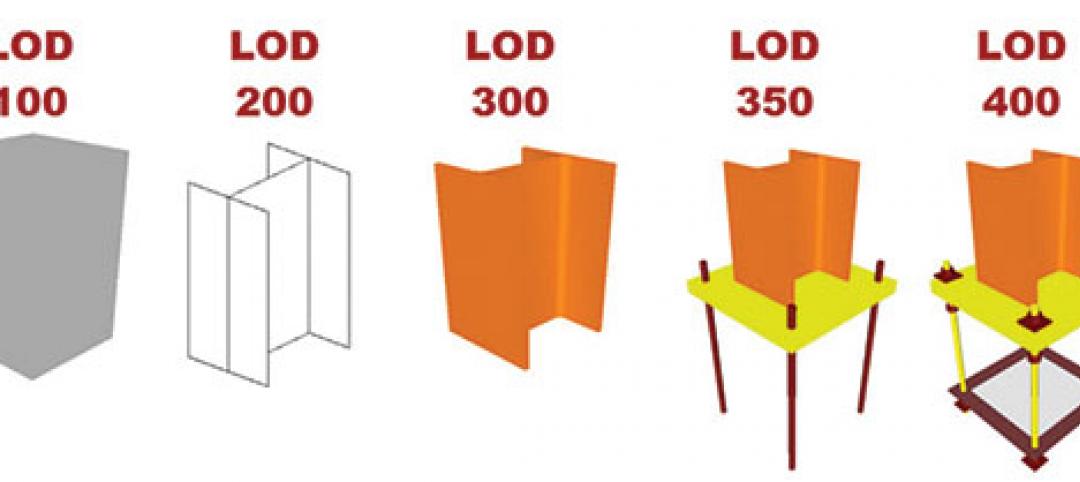
The lowdown on LODs: Bringing clarity to BIM
These days, BIM is par for the course across most facets of design. But a lot of the conversation surrounding BIM still lacks clarity due to ambiguous terminology, a lack of clear-cut guiding illustrations, and widely varying implementation, writes GS&P's John Scannell.

| Dec 28, 2014
The future of airport terminal design: destination status, five-star amenities, stress-free travel
Taking a cue from the hospitality industry, airport executives are seeking to make their facilities feel more like destinations, writes HOK's Richard Gammon.

| Dec 28, 2014
10 key design interventions for a healthier, happier, and more productive workplace
Numerous studies and mountains of evidence confirm what common sense has long suggested: healthy, happier workers are more productive, more likely to collaborate with colleagues, and more likely to innovate in ways that benefit the bottom line, writes Gensler's Kirsten Ritchie.

| Dec 28, 2014
7 fresh retail design strategies
Generic ‘boxes’ and indifferent service won’t cut it with today’s savvy shoppers. Retailers are seeking a technology-rich-but-handmade vibe, plus greater speed to market and adaptability.

| Dec 28, 2014
Workplace design trends: Make way for the Millennials
Driven by changing work styles, mobile technology, and the growing presence of Millennials, today’s workplaces are changing, mostly for the better. We examine the top office design trends.


