


Construction employment increased in 329 out of 358 metro areas between April and May as a new survey finds that two-thirds of highway construction firms had at least one crash in the past year at highway work zones they operate. Officials with the Associated General Contractors of America and HCSS, which conducted the survey, urged drivers to slow down and be aware while driving through highway work zones during their summer travels.
“As industry employment increases, it is safe to assume that more people are working in highway work zones that are typically close to moving traffic,” said Ken Simonson, the association’s chief economist. “And it is important to remember that any time your job site is just a few feet away from fast moving traffic, danger is never far away.”
Simonson noted that construction employment expanded in most parts of the country between April and May as coronavirus lockdowns began to ease, according to an analysis of federal employment data the association conducted. He noted that Seattle-Bellevue-Everett, Wash. added the most construction jobs (28,600, 44%) in May, followed by New York City (25,000, 31%) and Pittsburgh, Pa. (22,000, 60%). Click here for the complete analysis.
Many of those workers will be improving highways and bridges in work zones along busy highways this summer, the economist pointed out. That is why the association partnered with construction technology firm HCSS to conduct a nationwide survey of highway contractors on work zone safety. According to that survey, two-thirds of the 200-plus respondents reported at least one crash in the past year involving a moving vehicle at highway work zones, and 33% reported five or more crashes.
Seventeen percent of work zone crashes resulted in injury to construction workers, according to the survey. Meanwhile, drivers and passengers were injured in 44% of those crashes. Drivers and passengers are more likely to be killed in work zone crashes as well. Workers were killed in five percent of work zone crashes while drivers or passengers were killed in 15 percent of those crashes.
The only good news coming out of the survey, Simonson observed, is that coronavirus-related reductions in driving appear to have improved work zone safety. Fifty-eight percent of respondents said changes in highway traffic levels since the coronavirus made work zones safer. But with traffic already back to 90% of pre-coronavirus levels by some estimates, those safety improvements are likely “fleeting,” the economist said.
Association officials called for new measures to protect motorists and workers at highway construction sites. They noted that 24% of survey respondents say a greater police presence at work zones will improve safety. Another 18% say stricter laws against cell phone usage and distracted driving would help. And 17% would like to see greater use of devices like Jersey barriers to protect workers.
Association and HCSS officials said the easiest way to improve work zone safety is to get motorists to slow down and pay attention. They added that motorists should be careful navigating the narrower lanes and sudden lane shifts that are common in work zones. And they urged motorists to obey posted speed limits and keep their eyes on the road and off their phones.
“The importance of work zone safety can be measured by the lives that it saves,” said Steve McGough, the President and CFO of Sugar Land, Texas-based HCSS. “Saving the lives of our greatest asset, our people, has to come first in the planning and execution of work every day.”
Click here for the work zone survey results. And click here for the metro employment data.
Related Stories

Apartments | Aug 22, 2023
Key takeaways from RCLCO's 2023 apartment renter preferences study
Gregg Logan, Managing Director of real estate consulting firm RCLCO, reveals the highlights of RCLCO's new research study, “2023 Rental Consumer Preferences Report.” Logan speaks with BD+C's Robert Cassidy.
Market Data | Aug 18, 2023
Construction soldiers on, despite rising materials and labor costs
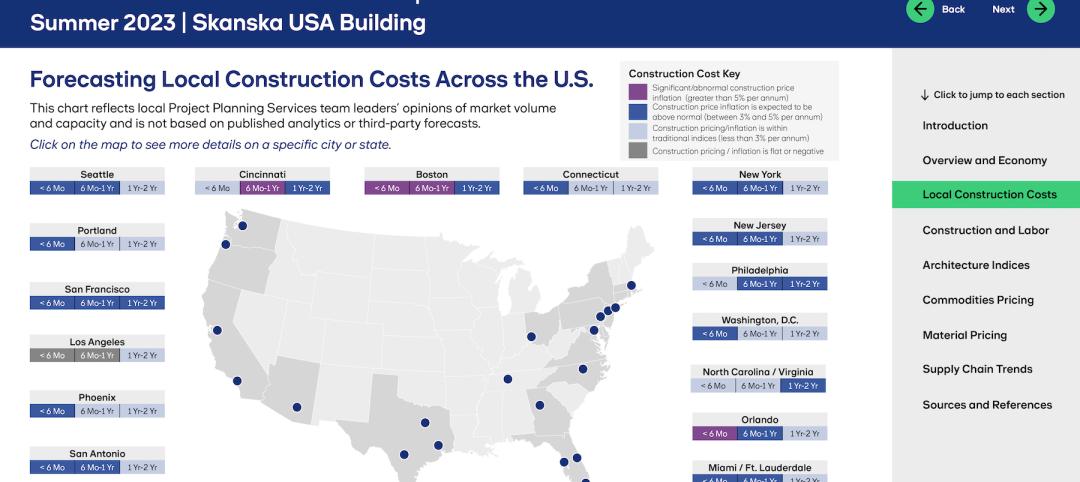
Quarterly analyses from Skanska, Mortenson, and Gordian show nonresidential building still subject to materials and labor volatility, and regional disparities.
Apartments | Aug 14, 2023
Yardi Matrix updates near-term multifamily supply forecast
The multifamily housing supply could increase by up to nearly 7% by the end of 2023, states the latest Multifamily Supply Forecast from Yardi Matrix.

Hotel Facilities | Aug 2, 2023
Top 5 markets for hotel construction
According to the United States Construction Pipeline Trend Report by Lodging Econometrics (LE) for Q2 2023, the five markets with the largest hotel construction pipelines are Dallas with a record-high 184 projects/21,501 rooms, Atlanta with 141 projects/17,993 rooms, Phoenix with 119 projects/16,107 rooms, Nashville with 116 projects/15,346 rooms, and Los Angeles with 112 projects/17,797 rooms.

Market Data | Aug 1, 2023
Nonresidential construction spending increases slightly in June
National nonresidential construction spending increased 0.1% in June, according to an Associated Builders and Contractors analysis of data published today by the U.S. Census Bureau. Spending is up 18% over the past 12 months. On a seasonally adjusted annualized basis, nonresidential spending totaled $1.07 trillion in June.

Hotel Facilities | Jul 27, 2023
U.S. hotel construction pipeline remains steady with 5,572 projects in the works
The hotel construction pipeline grew incrementally in Q2 2023 as developers and franchise companies push through short-term challenges while envisioning long-term prospects, according to Lodging Econometrics.

Hotel Facilities | Jul 26, 2023
Hospitality building construction costs for 2023
Data from Gordian breaks down the average cost per square foot for 15-story hotels, restaurants, fast food restaurants, and movie theaters across 10 U.S. cities: Boston, Chicago, Las Vegas, Los Angeles, Miami, New Orleans, New York, Phoenix, Seattle, and Washington, D.C.

Market Data | Jul 24, 2023
Leading economists call for 2% increase in building construction spending in 2024
Following a 19.7% surge in spending for commercial, institutional, and industrial buildings in 2023, leading construction industry economists expect spending growth to come back to earth in 2024, according to the July 2023 AIA Consensus Construction Forecast Panel.

Contractors | Jul 13, 2023
Construction input prices remain unchanged in June, inflation slowing
Construction input prices remained unchanged in June compared to the previous month, according to an Associated Builders and Contractors analysis of U.S. Bureau of Labor Statistics Producer Price Index data released today. Nonresidential construction input prices were also unchanged for the month.

Contractors | Jul 11, 2023
The average U.S. contractor has 8.9 months worth of construction work in the pipeline, as of June 2023
Associated Builders and Contractors reported that its Construction Backlog Indicator remained unchanged at 8.9 months in June 2023, according to an ABC member survey conducted June 20 to July 5. The reading is unchanged from June 2022.


